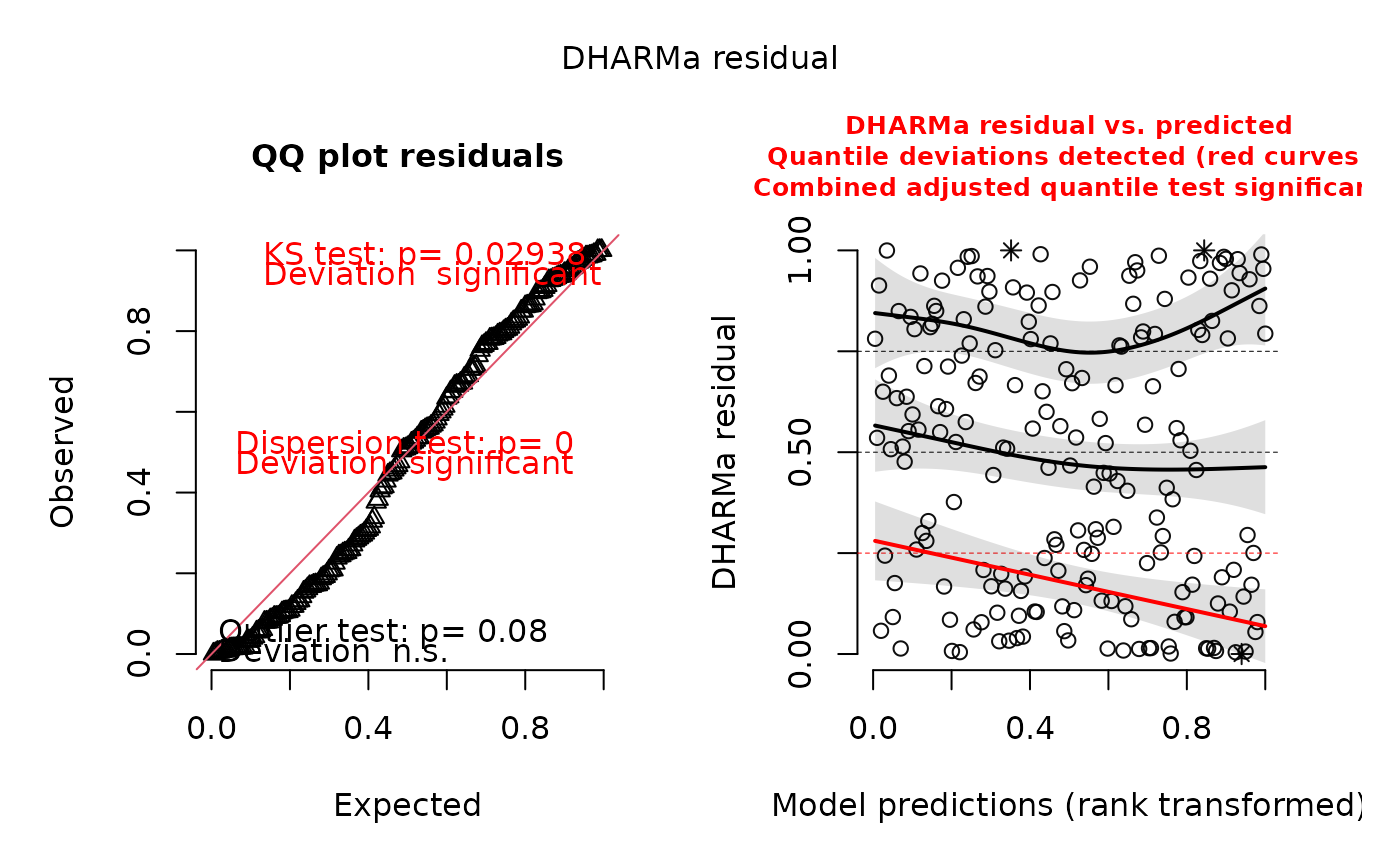
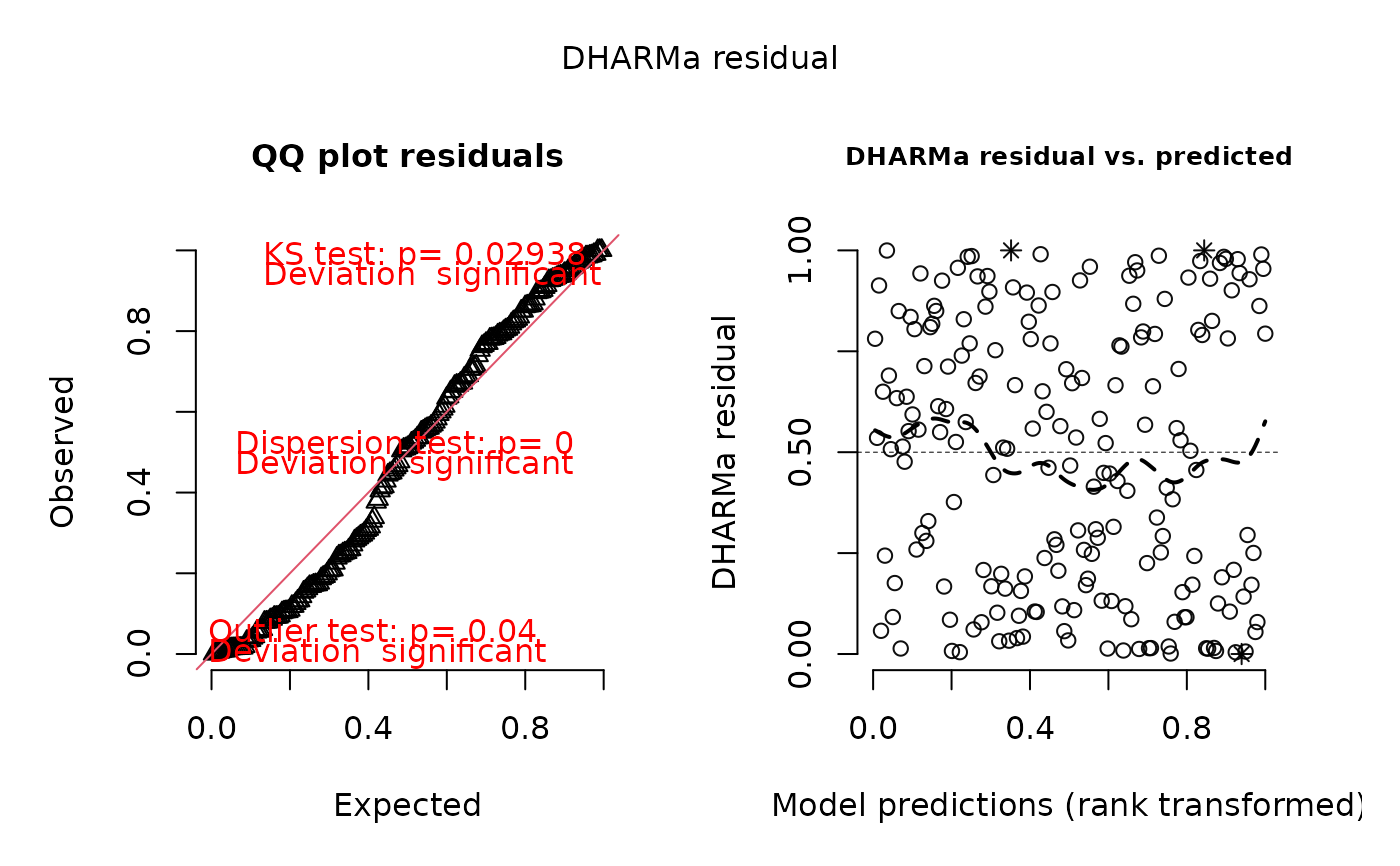
This S3 function creates standard plots for the simulated residuals contained in an object of class DHARMa, using plotQQunif (left panel) and plotResiduals (right panel).
Usage
# S3 method for class 'DHARMa'
plot(x, title = "DHARMa residual", ...)
Arguments
- x
an object of class DHARMa with simulated residuals created by simulateResiduals.
- title
the title for both panels (plotted via mtext, outer = TRUE).
- ...
further options for plotResiduals. Consider in particular parameters quantreg, rank and asFactor. xlab, ylab and main passed here only change the right panel (the residual plot); use plotResiduals and plotQQunif to fully control the labels of the individual plots.
Details
The function creates a plot with two panels. The left panel is a uniform qq plot (calling plotQQunif), and the right panel shows residuals against predicted values (calling plotResiduals), with outliers as a star/asterisk and highlighted in red if outlier test is significant (default color but see Note).
Very briefly, we would expect that a correctly specified model shows:
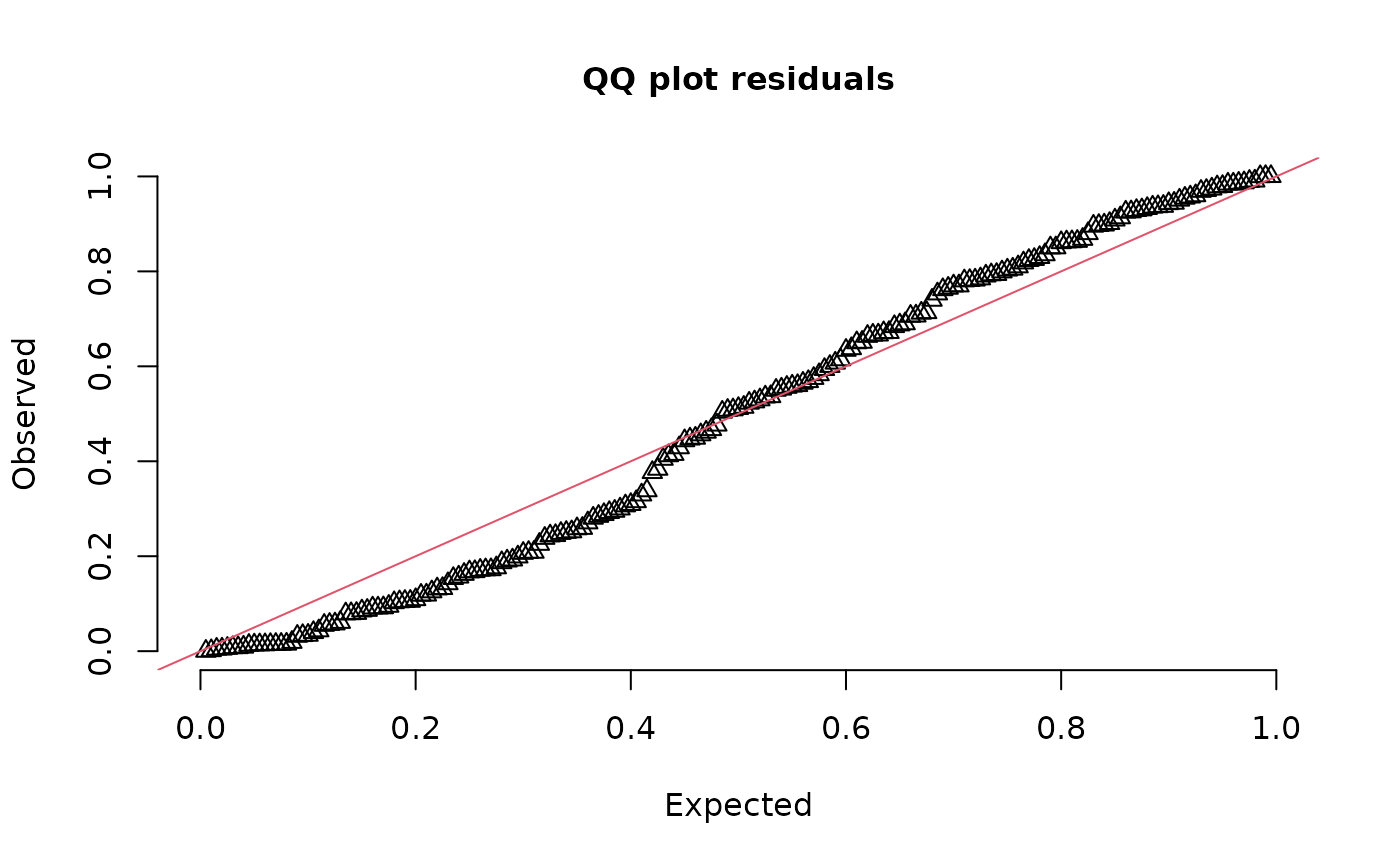
a) a straight 1-1 line, as well as non-significance of the displayed tests in the qq-plot (left) -> evidence for a correct overall residual distribution (for more details on the interpretation of this plot, see plotQQunif)
b) visual homogeneity of residuals in both vertical and horizontal direction, as well as non-significance of quantile tests in the res ~ predictor plot (for more details on the interpretation of this plot, see plotResiduals)
Deviations from these expectations can be interpreted similar to a linear regression. See the vignette for detailed examples.
Note
The color for highlighting outliers and significant tests can be changed by setting options(DHARMaSignalColor = "red") to a different color. See getOption("DHARMaSignalColor") for the current setting. This is convenient for a color-blind friendly display, since red and black are difficult for some people to separate.
Examples
testData = createData(sampleSize = 200, family = poisson(),
fixedEffects = c(1,1),
randomEffectVariance = 1, numGroups = 10)
testData$Environment2[1] = NA
fittedModel <- glm(observedResponse ~ Environment1 + Environment2,
family = "poisson", data = testData)
simulationOutput <- simulateResiduals(fittedModel = fittedModel)
######### main plotting function #############
plot(simulationOutput)
 # for all functions, quantreg = T (default) will be more informative
# but slower. Alternative:
plot(simulationOutput, quantreg = FALSE)
 ############# Distribution ######################
plotQQunif(simulationOutput = simulationOutput,
testDispersion = FALSE,
testUniformity = FALSE,
testOutliers = FALSE)
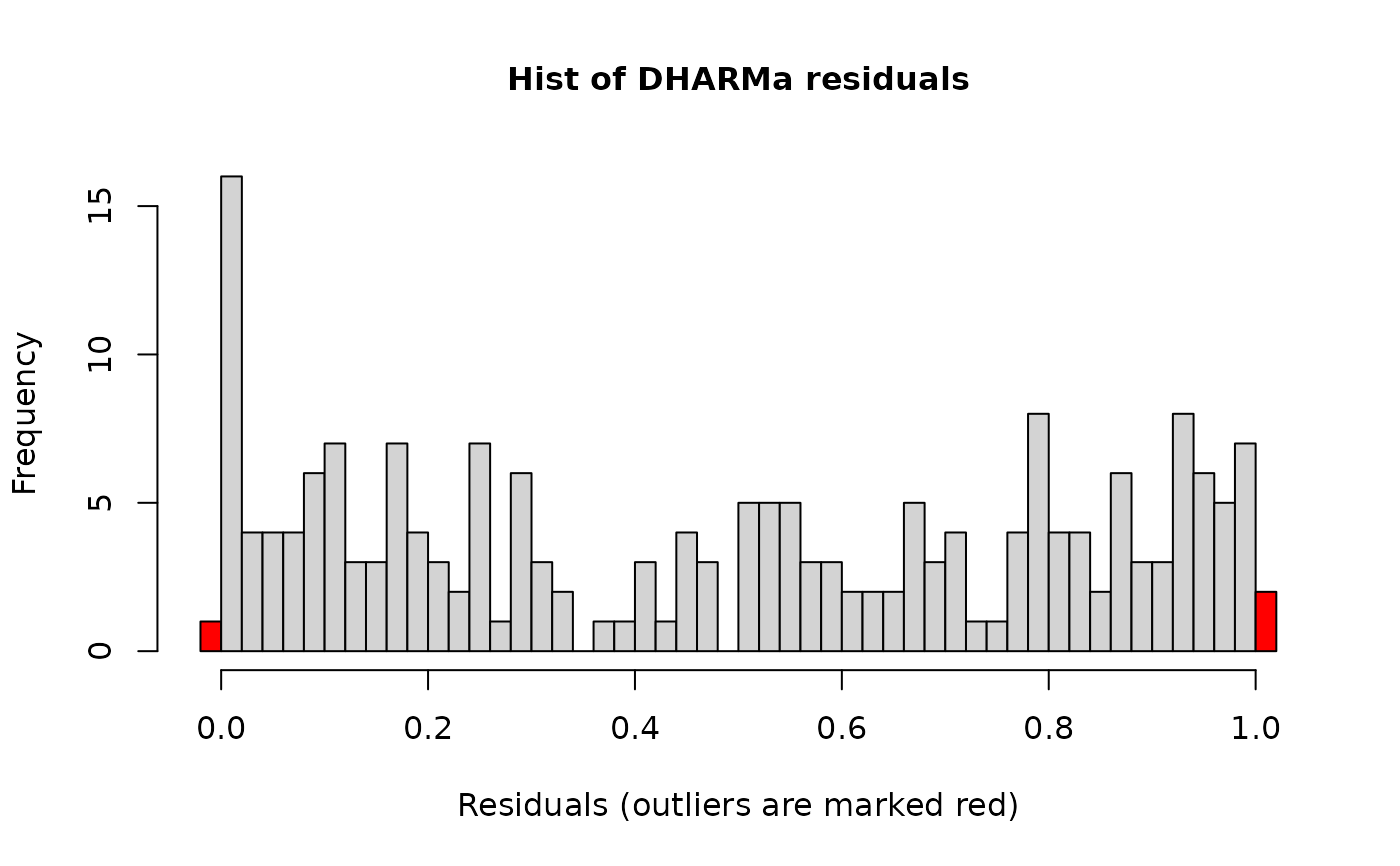
 hist(simulationOutput)