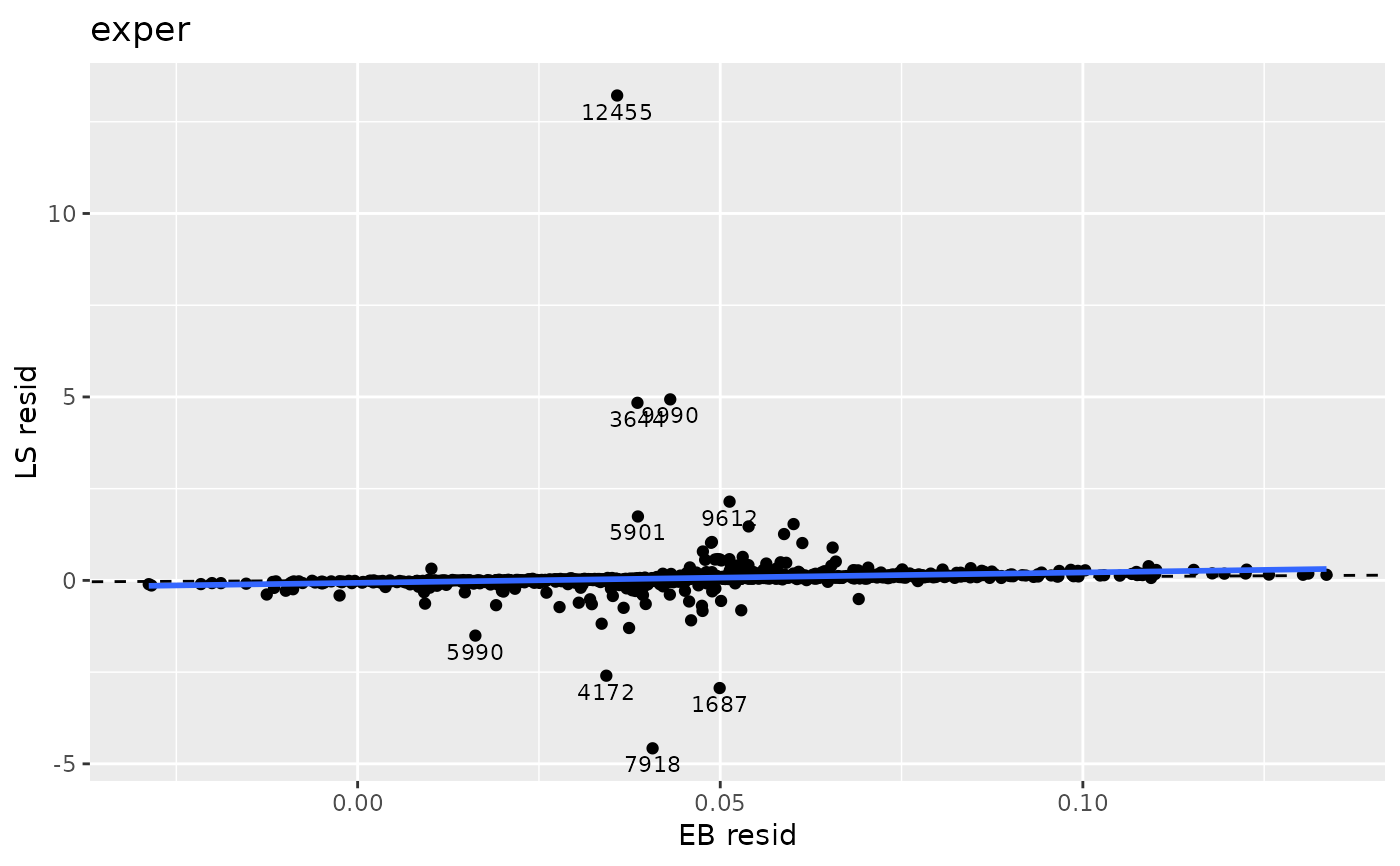
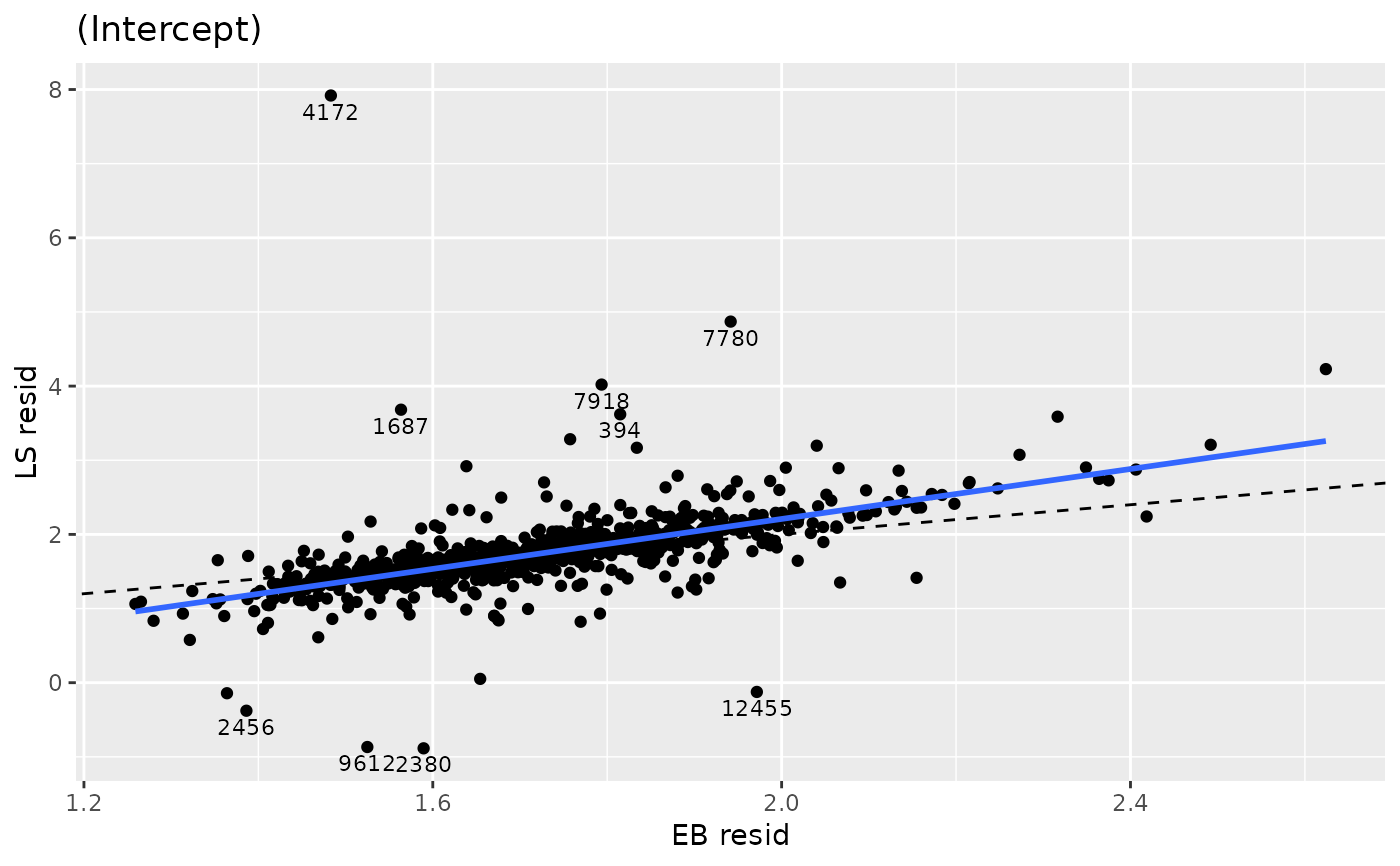
Visually comparing shrinkage and LS estimates
Source:R/group_level_residual_functions.R
compare_eb_ls.RdThis function creates a plot (using qplot()) where the shrinkage
estimate appears on the horizontal axis and the LS estimate appears on the
vertical axis.
compare_eb_ls(eb, ols, identify = FALSE, silent = TRUE, ...)Arguments
- eb
a matrix of random effects
- ols
a matrix of the OLS estimates found using
random_ls_coef- identify
the percentage of points to identify as unusual,
FALSEif you do not want the points identified.- silent
logical: should the list of data frames used to make the plots be suppressed.
- ...
other arguments to be passed to
qplot()
Examples
wages.fm1 <- lme4::lmer(lnw ~ exper + (exper | id), data = wages)
wages.sepLM <- adjust_lmList(lnw ~ exper | id, data = wages)
rancoef.eb <- coef(wages.fm1)$id
rancoef.ols <- coef(wages.sepLM)
compare_eb_ls(eb = rancoef.eb, ols = rancoef.ols, identify = 0.01)
#> `geom_smooth()` using formula = 'y ~ x'

#> `geom_smooth()` using formula = 'y ~ x'
#> Warning: Removed 38 rows containing non-finite outside the scale range
#> (`stat_smooth()`).
#> Warning: Removed 38 rows containing missing values or values outside the scale range
#> (`geom_point()`).
#> `geom_smooth()` using formula = 'y ~ x'
#> Warning: Removed 38 rows containing non-finite outside the scale range
#> (`stat_smooth()`).
#> Warning: Removed 38 rows containing missing values or values outside the scale range
#> (`geom_point()`).