This is a function that can be used to create (modified) dotplots for the diagnostic measures. The plot allows the user to understand the distribution of the diagnostic measure and visually identify unusual cases.
dotplot_diag(
  x,
  cutoff,
  name = c("cooks.distance", "mdffits", "covratio", "covtrace", "rvc", "leverage"),
  data,
  index = NULL,
  modify = FALSE,
  ...
)
Arguments
- x
values of the diagnostic of interest
- cutoff
value(s) specifying the boundary for unusual values of the diagnostic. The cutoff(s) can either be supplied by the user, or automatically calculated using measures of internal scaling if
cutoff = "internal".- name
what diagnostic is being plotted (one of
"cooks.distance","mdffits","covratio","covtrace","rvc", or"leverage"). This is used for the calculation of "internal" cutoffs.- data
data frame to use (optional)
- index
optional parameter to specify index (IDs) of
xvalues. IfNULL(default), values will be indexed in the order of the vector passed tox.- modify
specifies the
geomto be used to produce a space-saving modification: either"dotplot"or"boxplot"- ...
other arguments to be passed to
ggplot()
Note
The resulting plot uses coord_flip to rotate the plot, so when
adding customized axis labels you will need to flip the names
between the x and y axes.
Examples
data(sleepstudy, package = 'lme4')
fm <- lme4::lmer(Reaction ~ Days + (Days | Subject), sleepstudy)
#Observation level deletion and diagnostics
obs.infl <- hlm_influence(fm, level = 1)
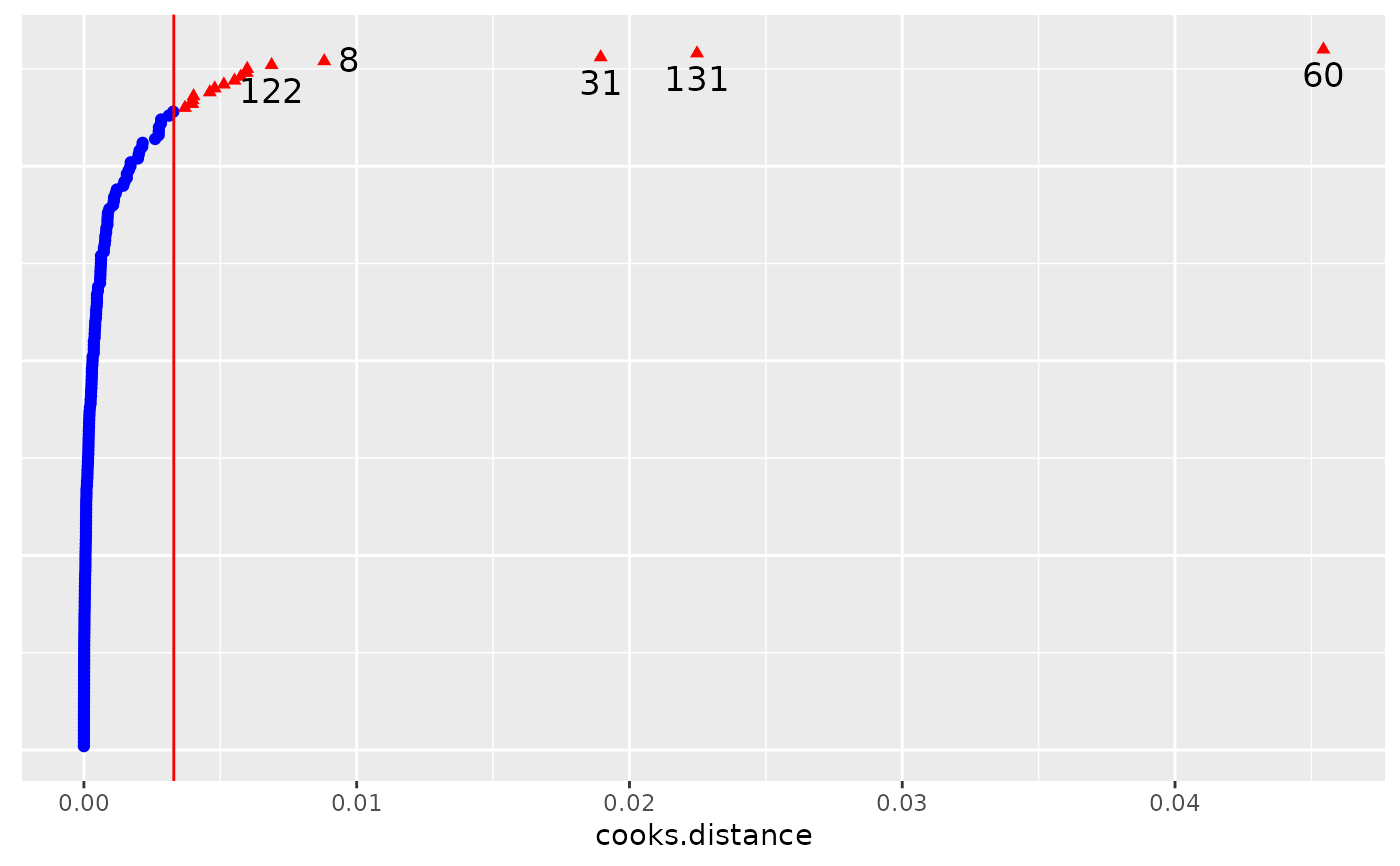
dotplot_diag(x = obs.infl$cooksd, cutoff = "internal", name = "cooks.distance", modify = FALSE)
 dotplot_diag(x = obs.infl$mdffits, cutoff = "internal", name = "cooks.distance", modify = FALSE)
 # Subject level deletion and diagnostics
subject.infl <- hlm_influence(fm, level = "Subject")
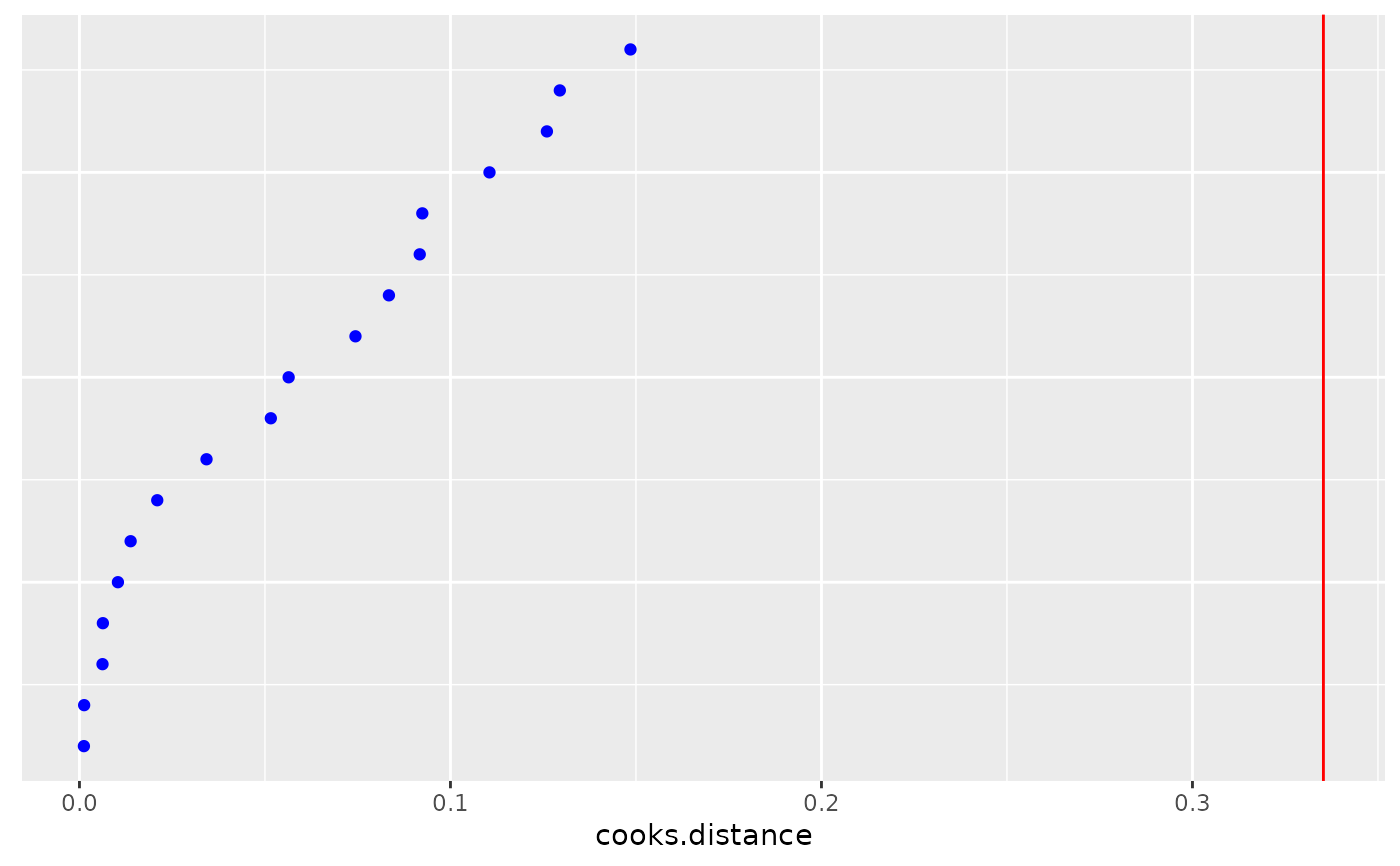
dotplot_diag(x = subject.infl$cooksd, cutoff = "internal",
name = "cooks.distance", modify = FALSE)
# Subject level deletion and diagnostics
subject.infl <- hlm_influence(fm, level = "Subject")
dotplot_diag(x = subject.infl$cooksd, cutoff = "internal",
name = "cooks.distance", modify = FALSE)
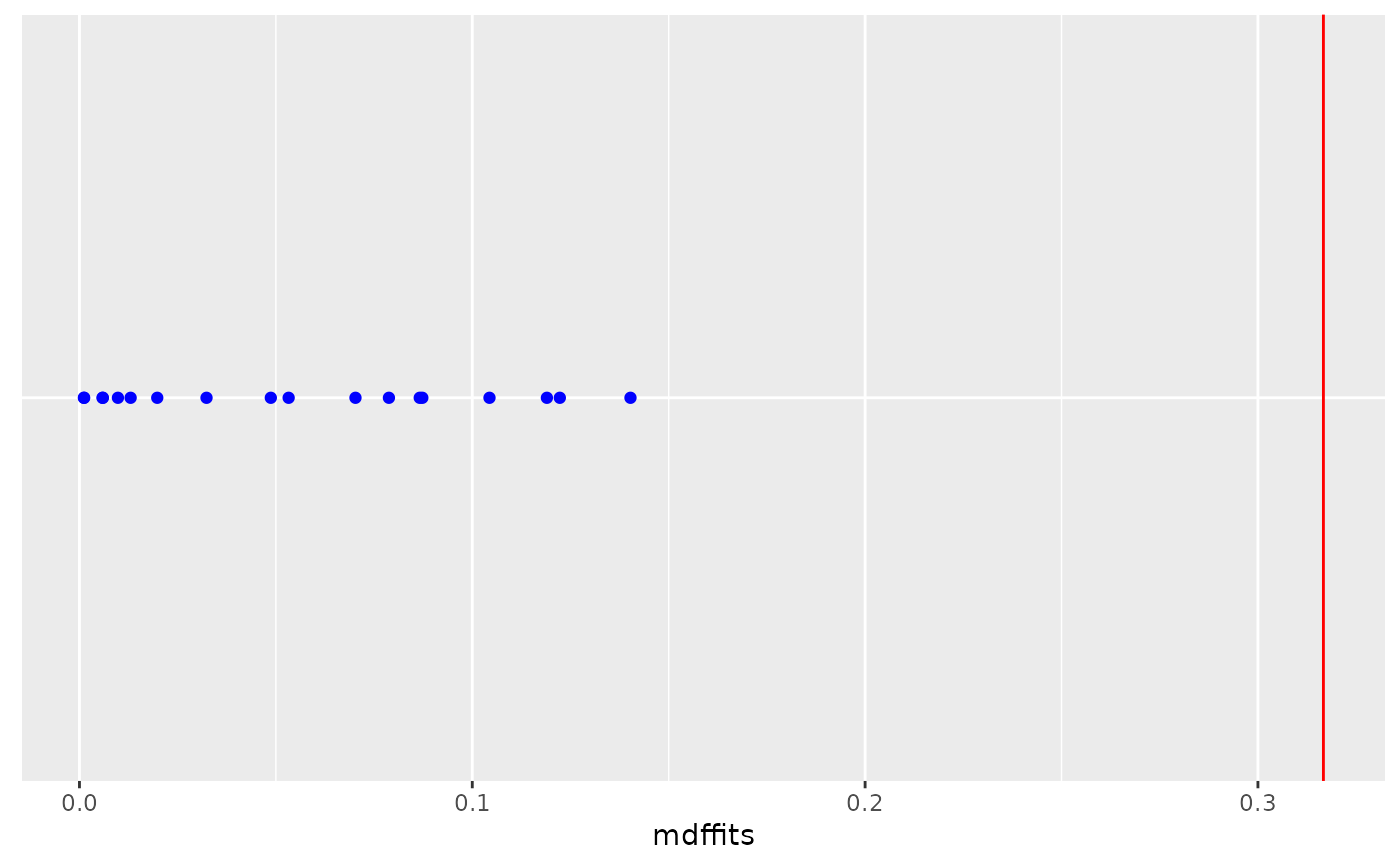
 dotplot_diag(x = subject.infl$mdffits, cutoff = "internal", name = "mdffits", modify = "dotplot")