Add a lowess smoother without counfidence bands.
stat_plsmo.RdAutomatically selects iter=0 for lowess if y is binary, otherwise uses iter=3.
stat_plsmo(
  mapping = NULL,
  data = NULL,
  geom = "smooth",
  position = "identity",
  n = 80,
  fullrange = FALSE,
  span = 2/3,
  fun = function(x) x,
  na.rm = FALSE,
  show.legend = NA,
  inherit.aes = TRUE,
  ...
)
Arguments
- mapping, data, geom, position, show.legend, inherit.aes
see ggplot2 documentation
- n
number of points to evaluate smoother at
- fullrange
should the fit span the full range of the plot, or just the data
- span
see
fargument tolowess- fun
a function to transform smoothed
y- na.rm
If
FALSE(the default), removes missing values with a warning. IfTRUEsilently removes missing values.- ...
other arguments are passed to smoothing function
Value
a data.frame with additional columns
- y
predicted value
See also
lowess for loess smoother.
Examples
# \donttest{
require(ggplot2)
c <- ggplot(mtcars, aes(qsec, wt))
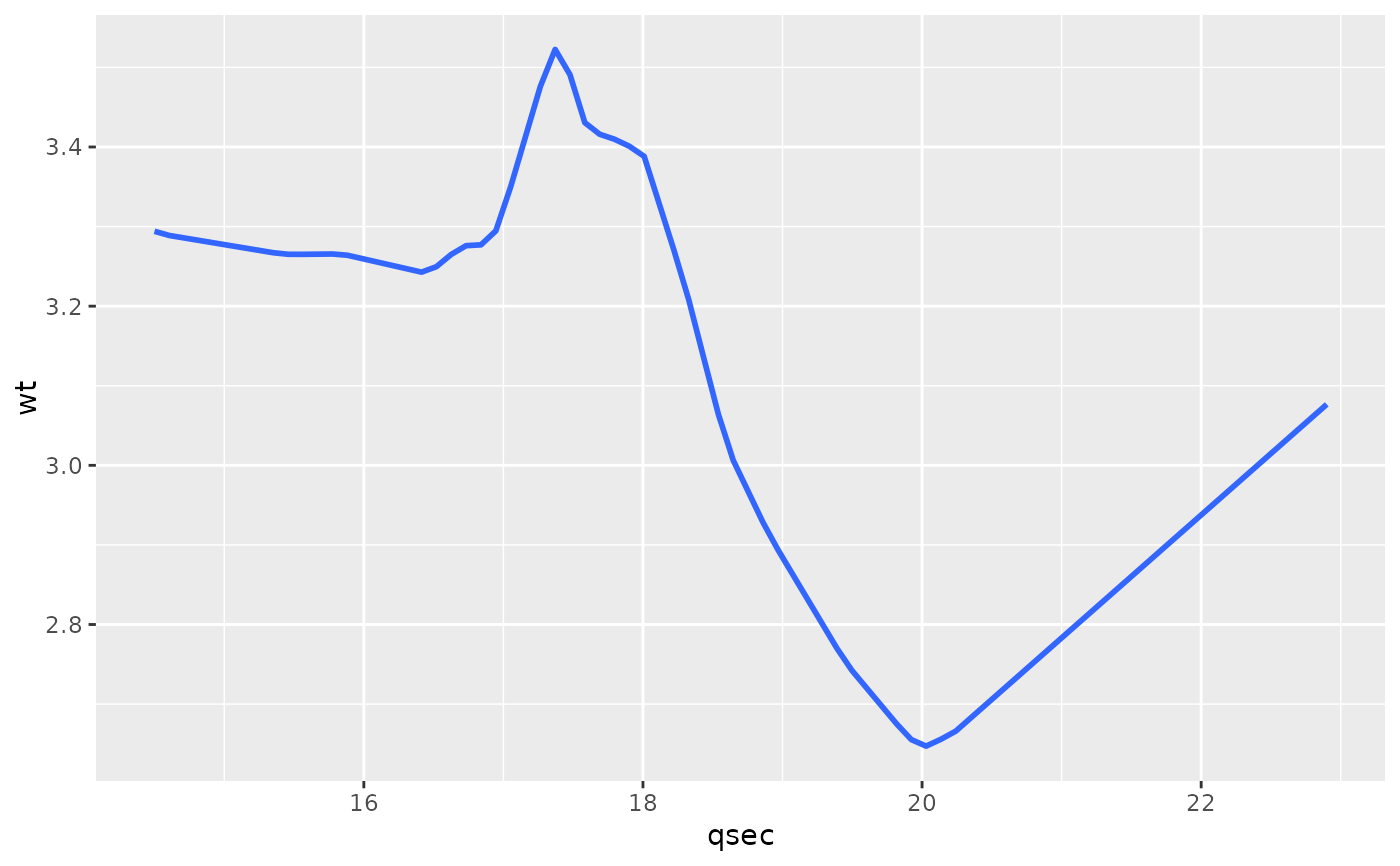
c + stat_plsmo()
#> Warning: collapsing to unique 'x' values
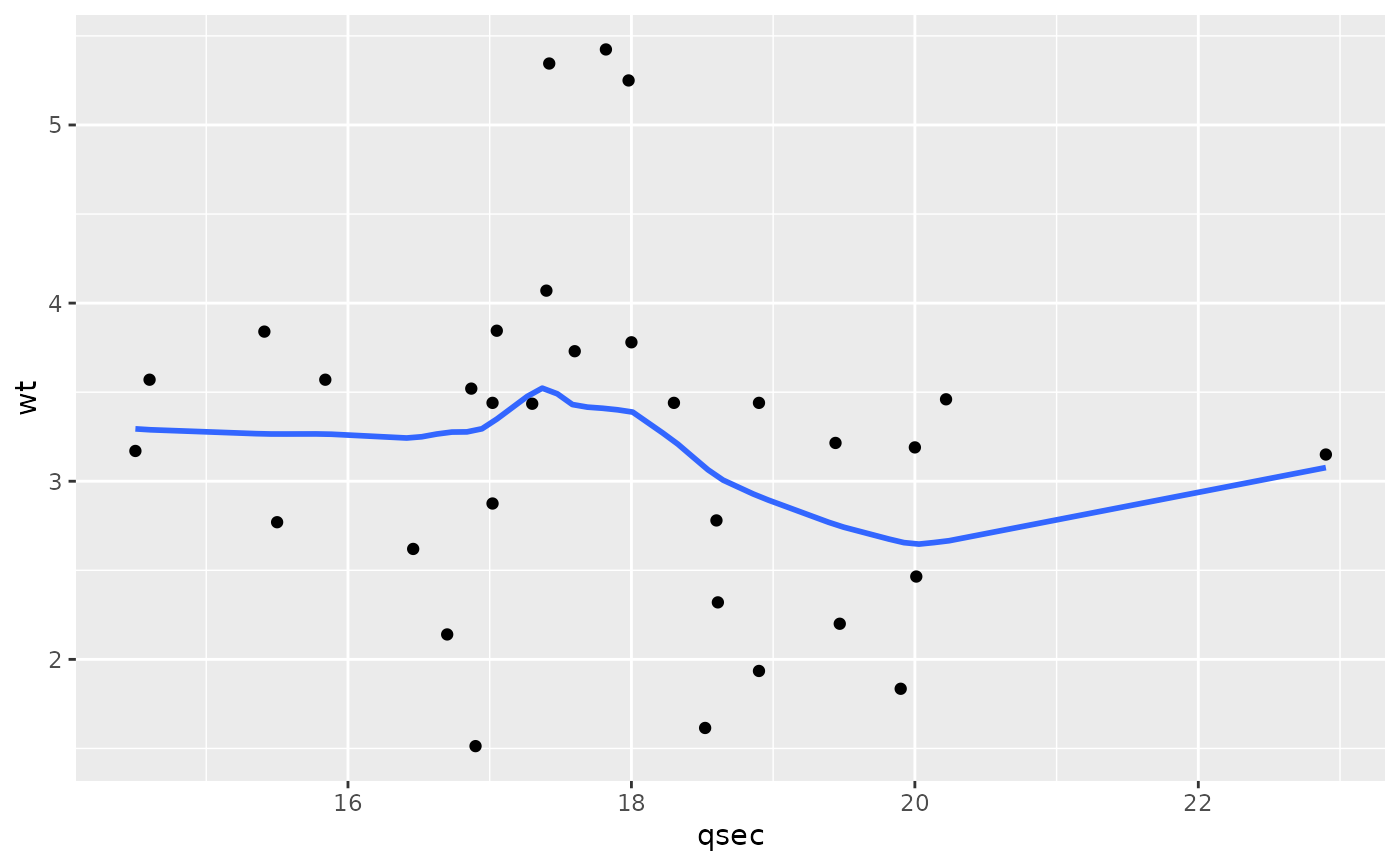
 c + stat_plsmo() + geom_point()
#> Warning: collapsing to unique 'x' values
c + stat_plsmo() + geom_point()
#> Warning: collapsing to unique 'x' values
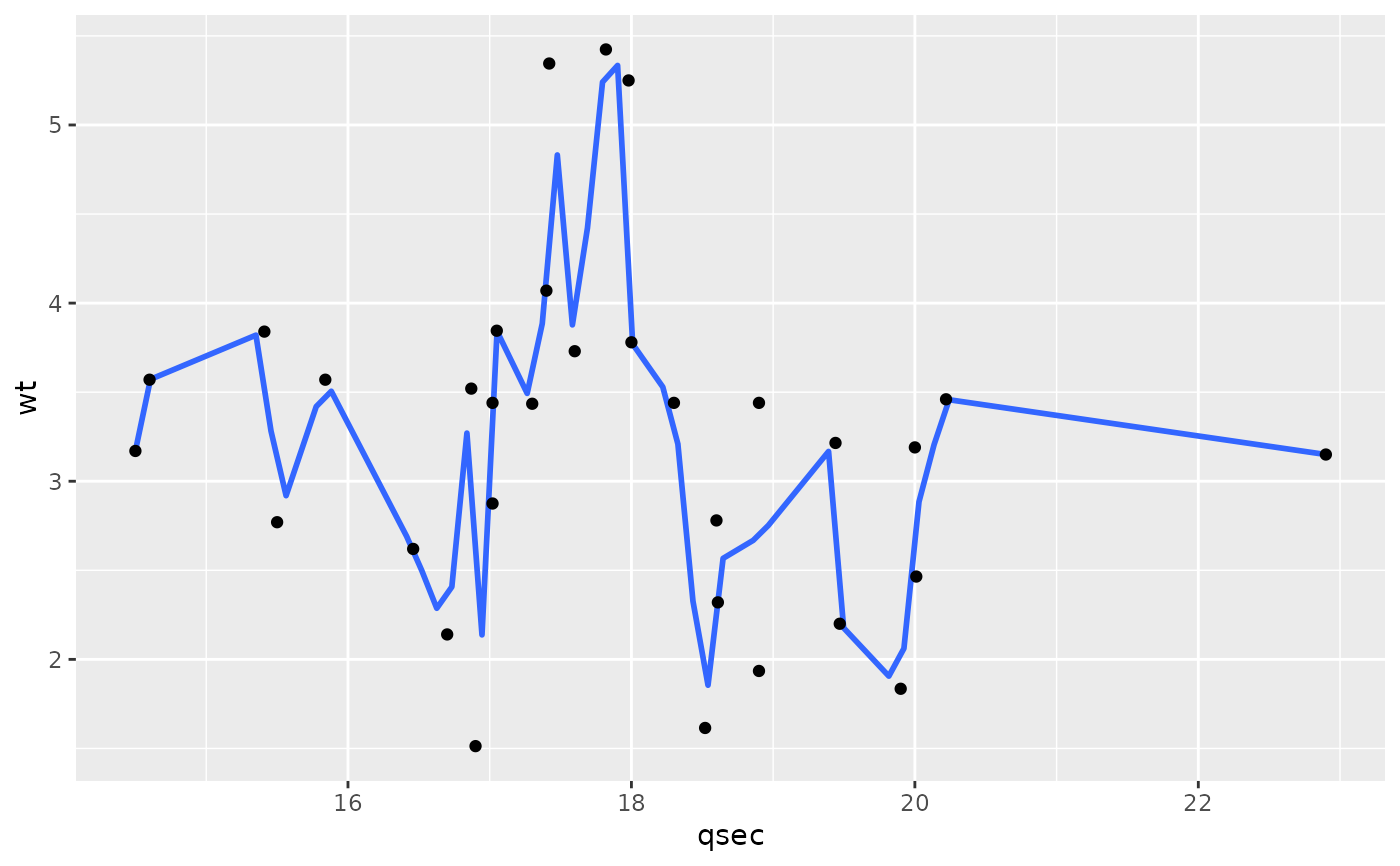
 c + stat_plsmo(span = 0.1) + geom_point()
#> Warning: collapsing to unique 'x' values
c + stat_plsmo(span = 0.1) + geom_point()
#> Warning: collapsing to unique 'x' values
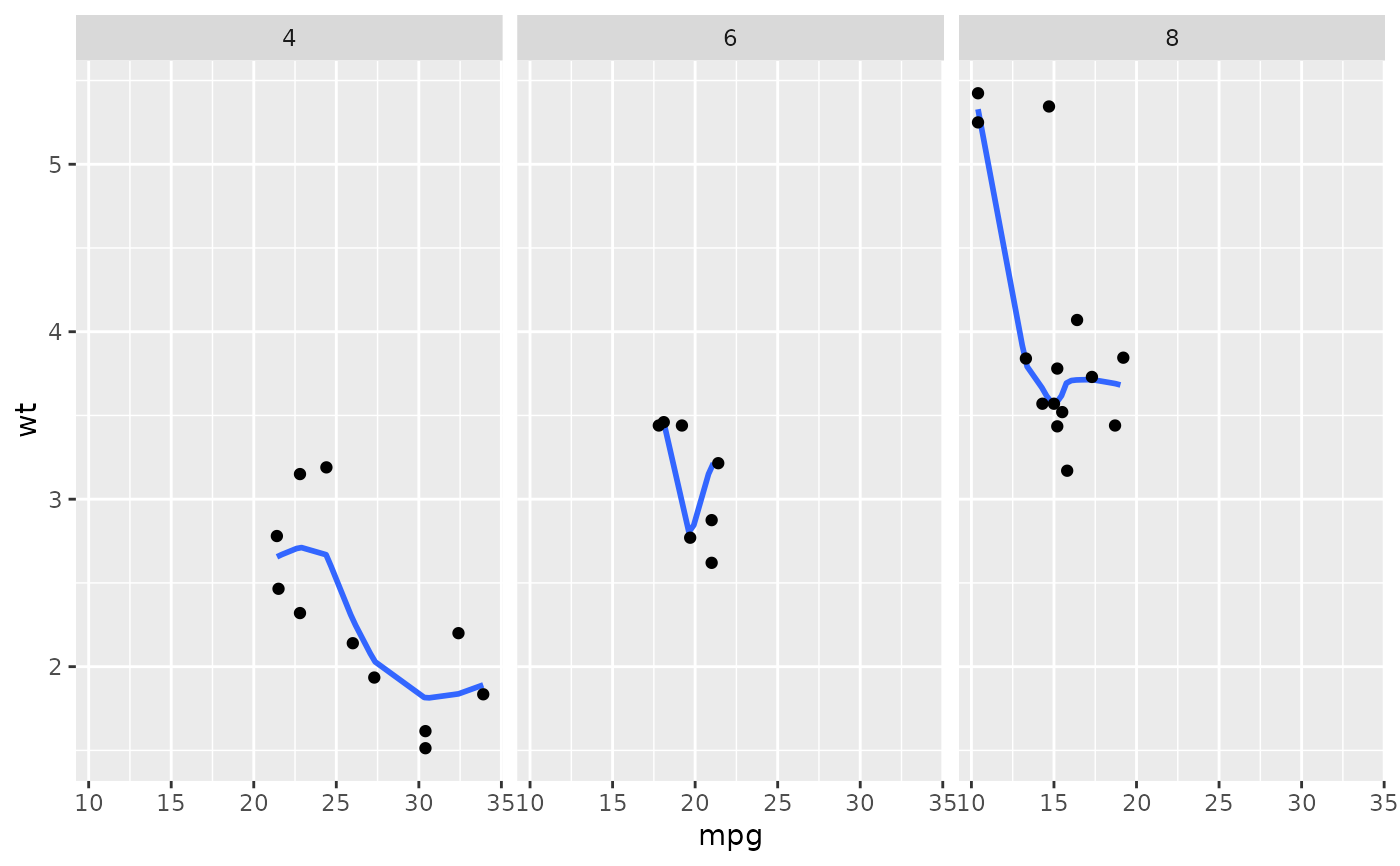
 # Smoothers for subsets
c <- ggplot(mtcars, aes(y=wt, x=mpg)) + facet_grid(. ~ cyl)
c + stat_plsmo() + geom_point()
#> Warning: collapsing to unique 'x' values
#> Warning: collapsing to unique 'x' values
#> Warning: collapsing to unique 'x' values
# Smoothers for subsets
c <- ggplot(mtcars, aes(y=wt, x=mpg)) + facet_grid(. ~ cyl)
c + stat_plsmo() + geom_point()
#> Warning: collapsing to unique 'x' values
#> Warning: collapsing to unique 'x' values
#> Warning: collapsing to unique 'x' values
 c + stat_plsmo(fullrange = TRUE) + geom_point()
#> Warning: collapsing to unique 'x' values
#> Warning: collapsing to unique 'x' values
#> Warning: collapsing to unique 'x' values
#> Warning: Removed 155 rows containing missing values or values outside the scale range
#> (`geom_smooth()`).
c + stat_plsmo(fullrange = TRUE) + geom_point()
#> Warning: collapsing to unique 'x' values
#> Warning: collapsing to unique 'x' values
#> Warning: collapsing to unique 'x' values
#> Warning: Removed 155 rows containing missing values or values outside the scale range
#> (`geom_smooth()`).
 # Geoms and stats are automatically split by aesthetics that are factors
c <- ggplot(mtcars, aes(y=wt, x=mpg, colour=factor(cyl)))
c + stat_plsmo() + geom_point()
#> Warning: collapsing to unique 'x' values
#> Warning: collapsing to unique 'x' values
#> Warning: collapsing to unique 'x' values
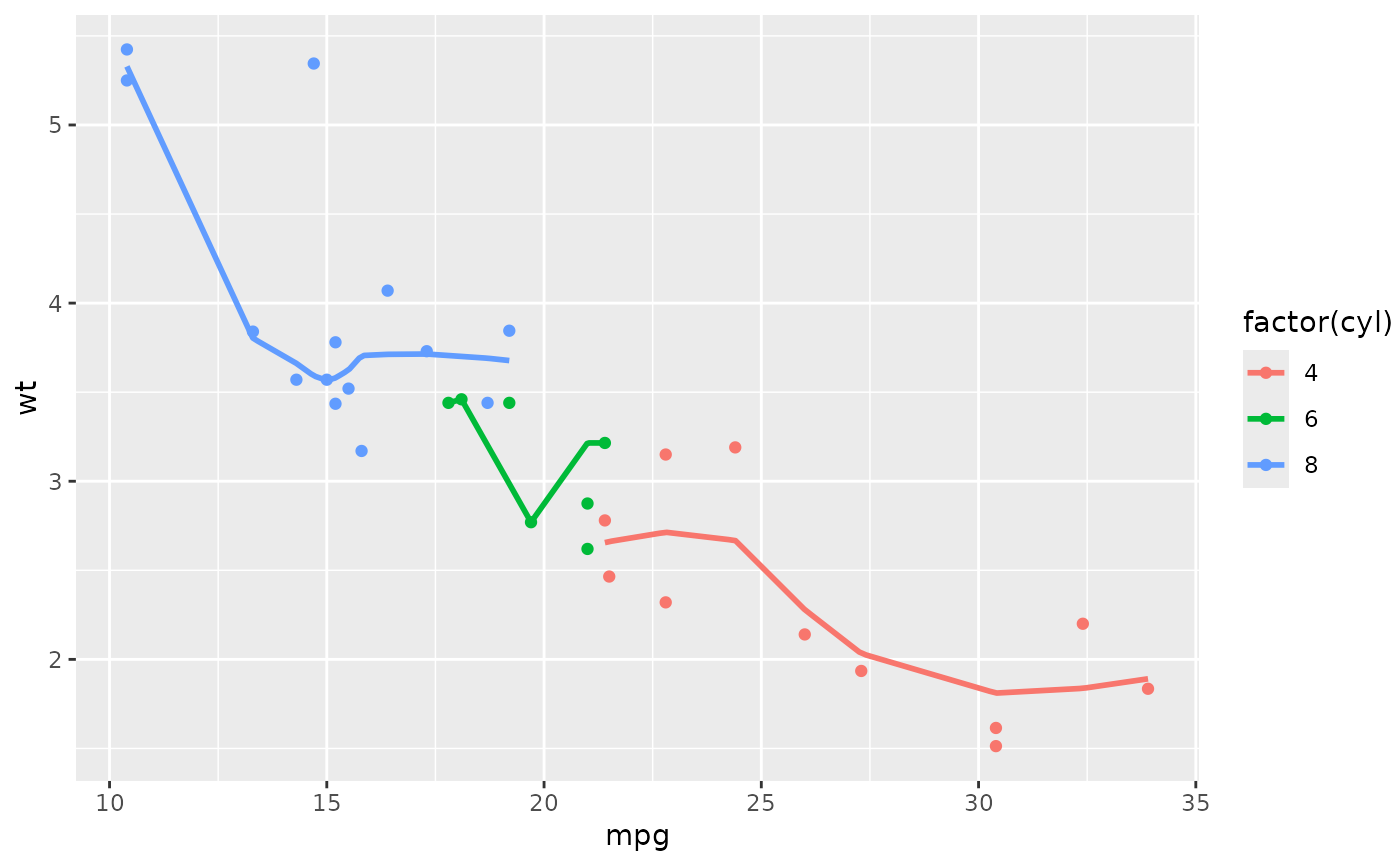
# Geoms and stats are automatically split by aesthetics that are factors
c <- ggplot(mtcars, aes(y=wt, x=mpg, colour=factor(cyl)))
c + stat_plsmo() + geom_point()
#> Warning: collapsing to unique 'x' values
#> Warning: collapsing to unique 'x' values
#> Warning: collapsing to unique 'x' values
 c + stat_plsmo(aes(fill = factor(cyl))) + geom_point()
#> Warning: collapsing to unique 'x' values
#> Warning: collapsing to unique 'x' values
#> Warning: collapsing to unique 'x' values
c + stat_plsmo(aes(fill = factor(cyl))) + geom_point()
#> Warning: collapsing to unique 'x' values
#> Warning: collapsing to unique 'x' values
#> Warning: collapsing to unique 'x' values
 c + stat_plsmo(fullrange=TRUE) + geom_point()
#> Warning: collapsing to unique 'x' values
#> Warning: collapsing to unique 'x' values
#> Warning: collapsing to unique 'x' values
#> Warning: Removed 155 rows containing missing values or values outside the scale range
#> (`geom_smooth()`).
c + stat_plsmo(fullrange=TRUE) + geom_point()
#> Warning: collapsing to unique 'x' values
#> Warning: collapsing to unique 'x' values
#> Warning: collapsing to unique 'x' values
#> Warning: Removed 155 rows containing missing values or values outside the scale range
#> (`geom_smooth()`).
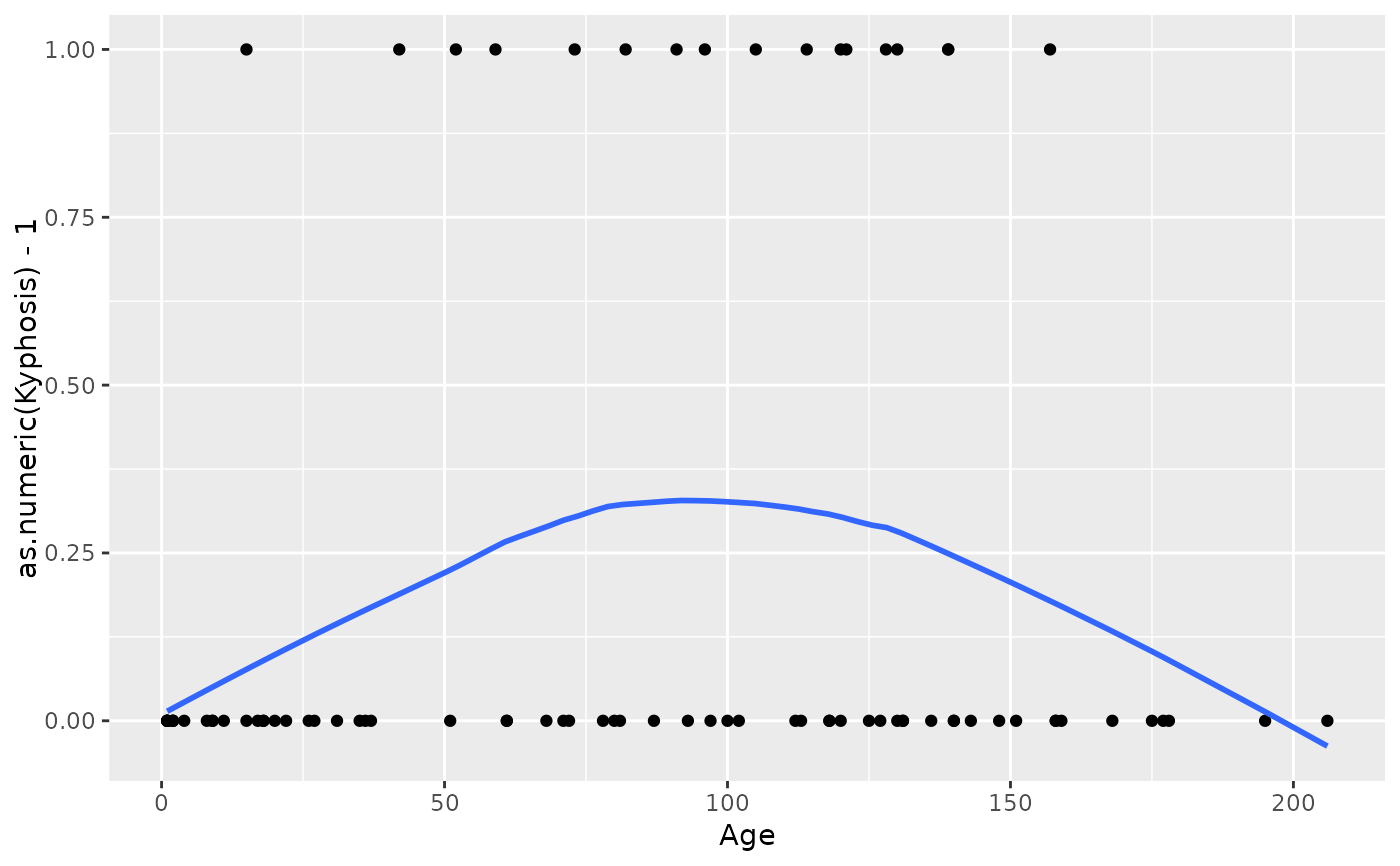
 # Example with logistic regression
data("kyphosis", package="rpart")
qplot(Age, as.numeric(Kyphosis) - 1, data = kyphosis) + stat_plsmo()
#> Warning: `qplot()` was deprecated in ggplot2 3.4.0.
#> Warning: collapsing to unique 'x' values
# Example with logistic regression
data("kyphosis", package="rpart")
qplot(Age, as.numeric(Kyphosis) - 1, data = kyphosis) + stat_plsmo()
#> Warning: `qplot()` was deprecated in ggplot2 3.4.0.
#> Warning: collapsing to unique 'x' values
 # }
# }