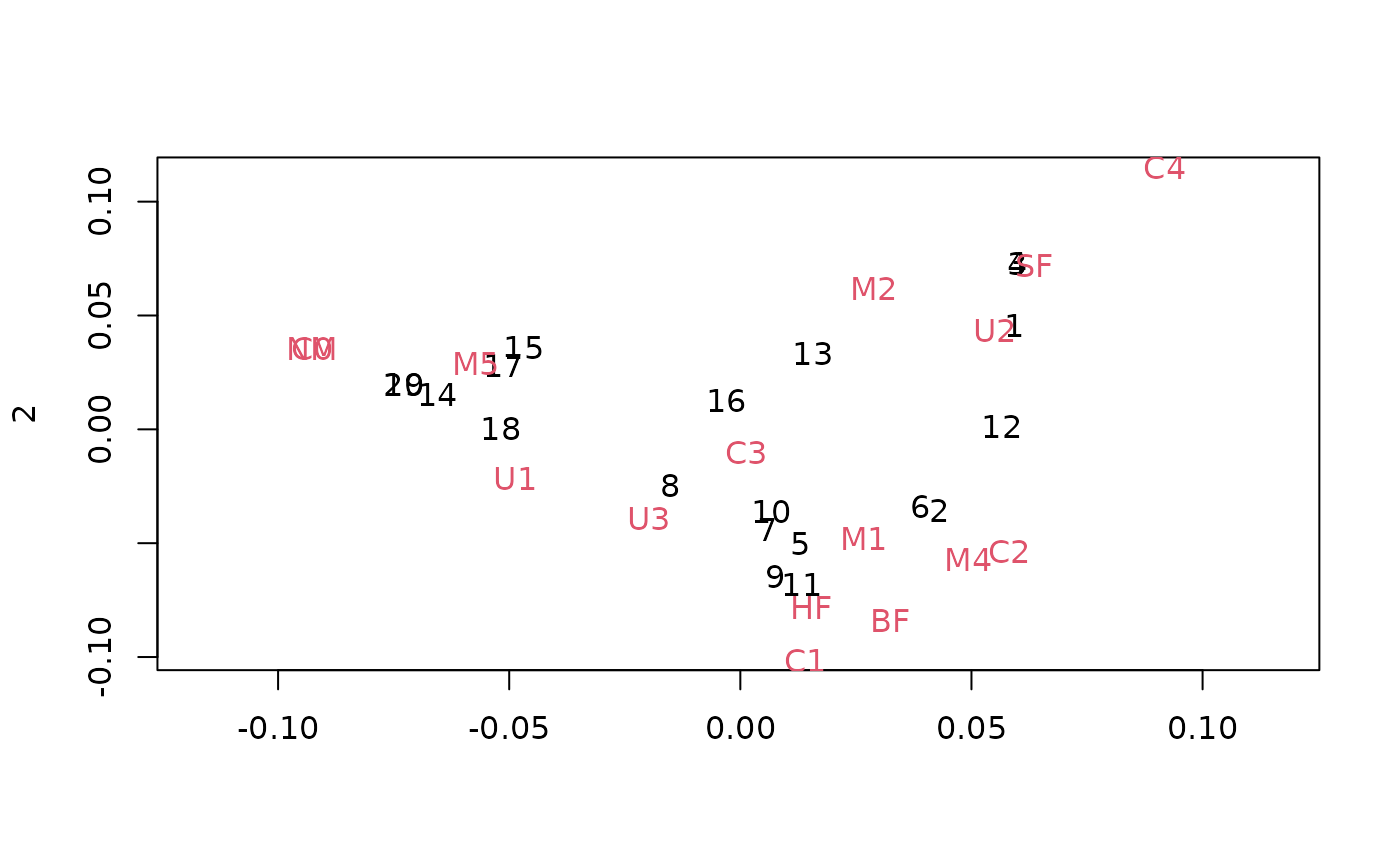
Plot Method for Objects of Class 'mca'
plot.mca.RdPlot a multiple correspondence analysis.
Arguments
References
Venables, W. N. and Ripley, B. D. (2002) Modern Applied Statistics with S. Fourth edition. Springer.
plot.mca.RdPlot a multiple correspondence analysis.
Venables, W. N. and Ripley, B. D. (2002) Modern Applied Statistics with S. Fourth edition. Springer.