Prints the histogram and corresponding density curve
panel.hist(x, col.bar = "gray", ...)Details
This function prints a combined histogram and density curve for use with the pairs function
References
Ekstrom, CT (2011) The R Primer.
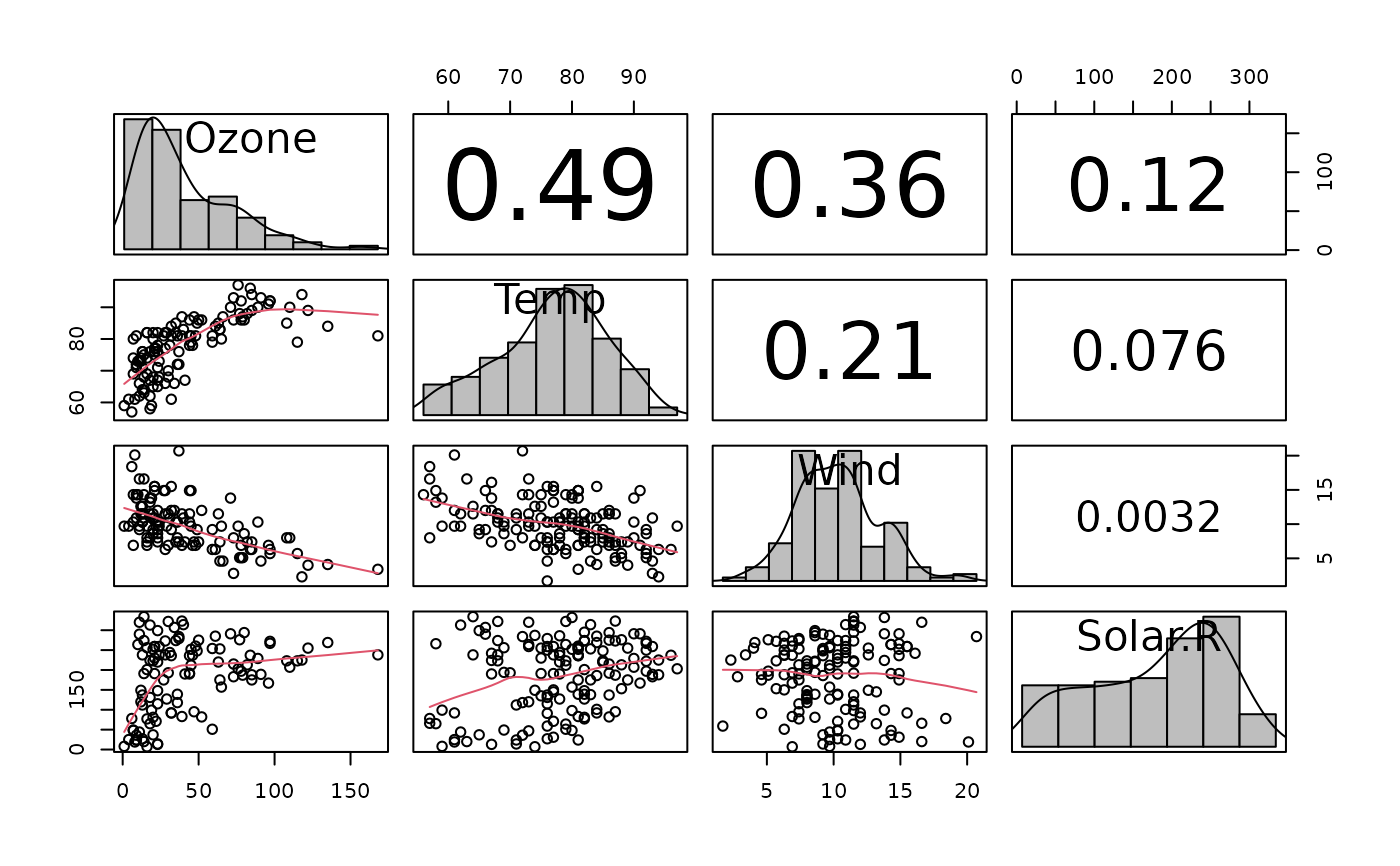
Examples
pairs(~ Ozone + Temp + Wind + Solar.R, data=airquality,
      lower.panel=panel.smooth, diag.panel=panel.hist,
      upper.panel=panel.r2)
#> Warning: argument 1 does not name a graphical parameter
#> Warning: argument 1 does not name a graphical parameter
#> Warning: argument 1 does not name a graphical parameter
#> Warning: argument 1 does not name a graphical parameter
#> Warning: argument 1 does not name a graphical parameter
#> Warning: argument 1 does not name a graphical parameter
#> Warning: argument 1 does not name a graphical parameter
#> Warning: argument 1 does not name a graphical parameter
#> Warning: argument 1 does not name a graphical parameter
#> Warning: argument 1 does not name a graphical parameter