Prints the R2 with text size depending on the size of R2
panel.r2(x, y, digits = 2, cex.cor, ...)Arguments
Details
This function is a slight modification of the panel.cor function defined on the pairs help page. It calculated and prints the squared correlation, R2, with text size depending on the proportion of explained variation.
References
Ekstrom, CT (2011) The R Primer.
Examples
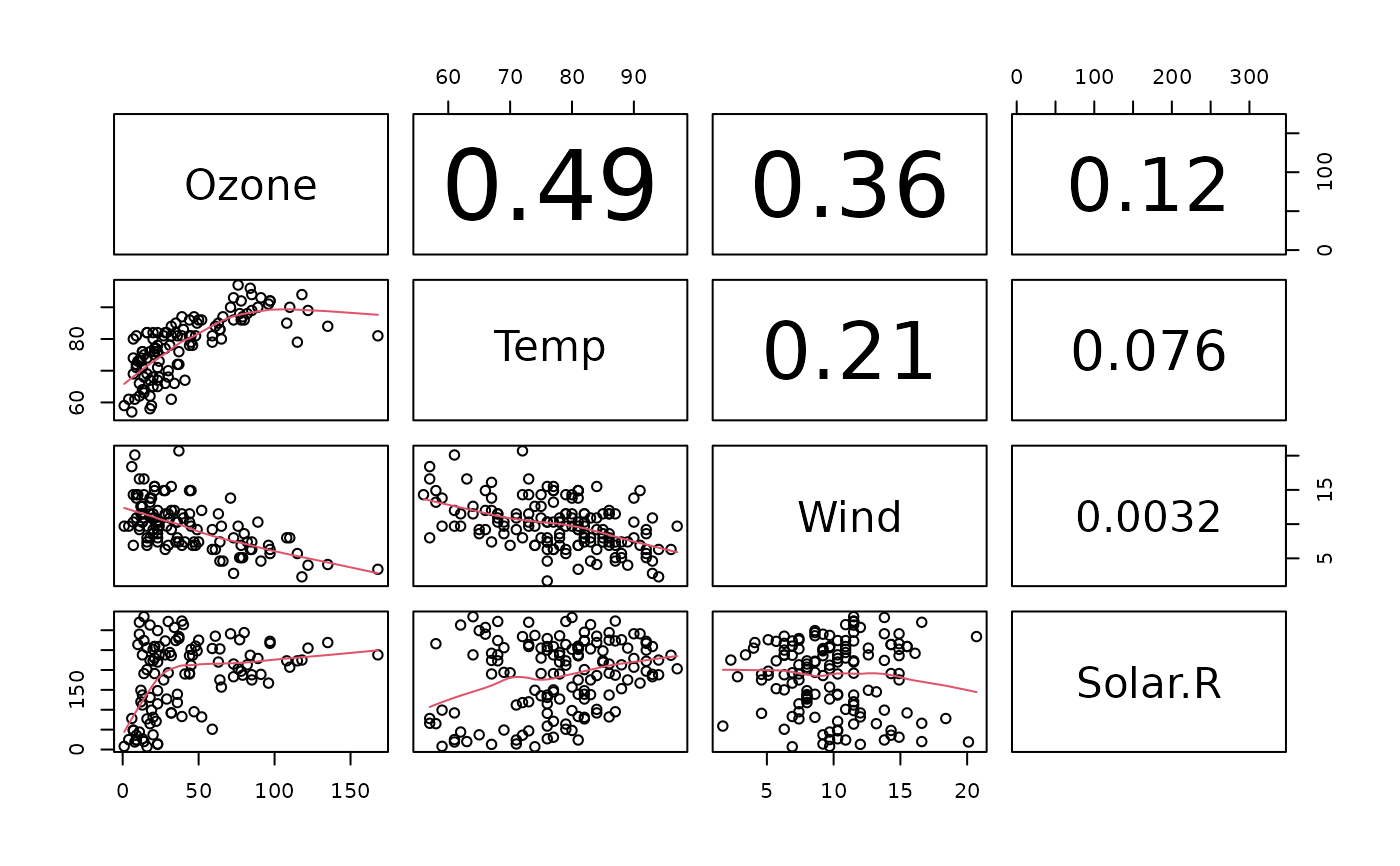
pairs(~ Ozone + Temp + Wind + Solar.R, data=airquality,
      lower.panel=panel.smooth, upper.panel=panel.r2)
#> Warning: argument 1 does not name a graphical parameter
#> Warning: argument 1 does not name a graphical parameter
#> Warning: argument 1 does not name a graphical parameter
#> Warning: argument 1 does not name a graphical parameter
#> Warning: argument 1 does not name a graphical parameter
#> Warning: argument 1 does not name a graphical parameter