The Dagum Distribution
dagumUC.RdDensity, distribution function, quantile function and random
generation for the Dagum distribution with shape parameters
a and p, and scale parameter scale.
ddagum(x, scale = 1, shape1.a, shape2.p, log = FALSE)
pdagum(q, scale = 1, shape1.a, shape2.p, lower.tail = TRUE,
       log.p = FALSE)
qdagum(p, scale = 1, shape1.a, shape2.p, lower.tail = TRUE,
       log.p = FALSE)
rdagum(n, scale = 1, shape1.a, shape2.p)
Arguments
Value
ddagum gives the density,
pdagum gives the distribution function,
qdagum gives the quantile function, and
rdagum generates random deviates.
References
Kleiber, C. and Kotz, S. (2003). Statistical Size Distributions in Economics and Actuarial Sciences, Hoboken, NJ, USA: Wiley-Interscience.
Details
See dagum, which is the VGAM family function
for estimating the parameters by maximum likelihood estimation.
Note
The Dagum distribution is a special case of the 4-parameter generalized beta II distribution.
Examples
probs <- seq(0.1, 0.9, by = 0.1)
shape1.a <- 1; shape2.p <- 2
# Should be 0:
max(abs(pdagum(qdagum(probs, shape1.a = shape1.a, shape2.p =
shape2.p), shape1.a = shape1.a, shape2.p = shape2.p) - probs))
#> [1] 5.551115e-17
if (FALSE) par(mfrow = c(1, 2))
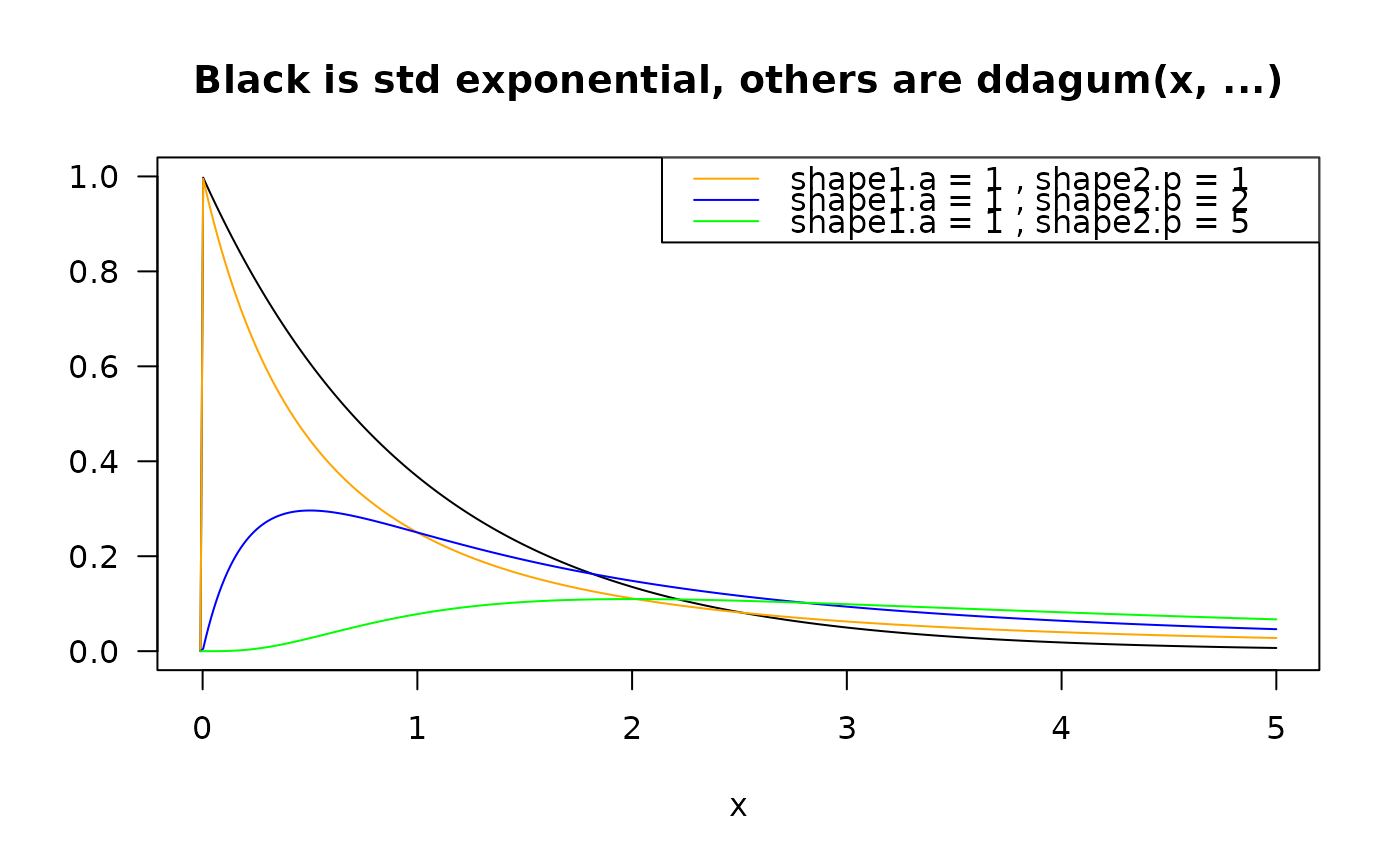
x <- seq(-0.01, 5, len = 401)
plot(x, dexp(x), type = "l", col = "black",
ylab = "", las = 1, ylim = c(0, 1),
main = "Black is std exponential, others are ddagum(x, ...)")
lines(x, ddagum(x, shape1.a = shape1.a, shape2.p = 1), col = "orange")
lines(x, ddagum(x, shape1.a = shape1.a, shape2.p = 2), col = "blue")
lines(x, ddagum(x, shape1.a = shape1.a, shape2.p = 5), col = "green")
legend("topright", col = c("orange","blue","green"),
lty = rep(1, len = 3), legend = paste("shape1.a =", shape1.a,
", shape2.p =", c(1, 2, 5)))
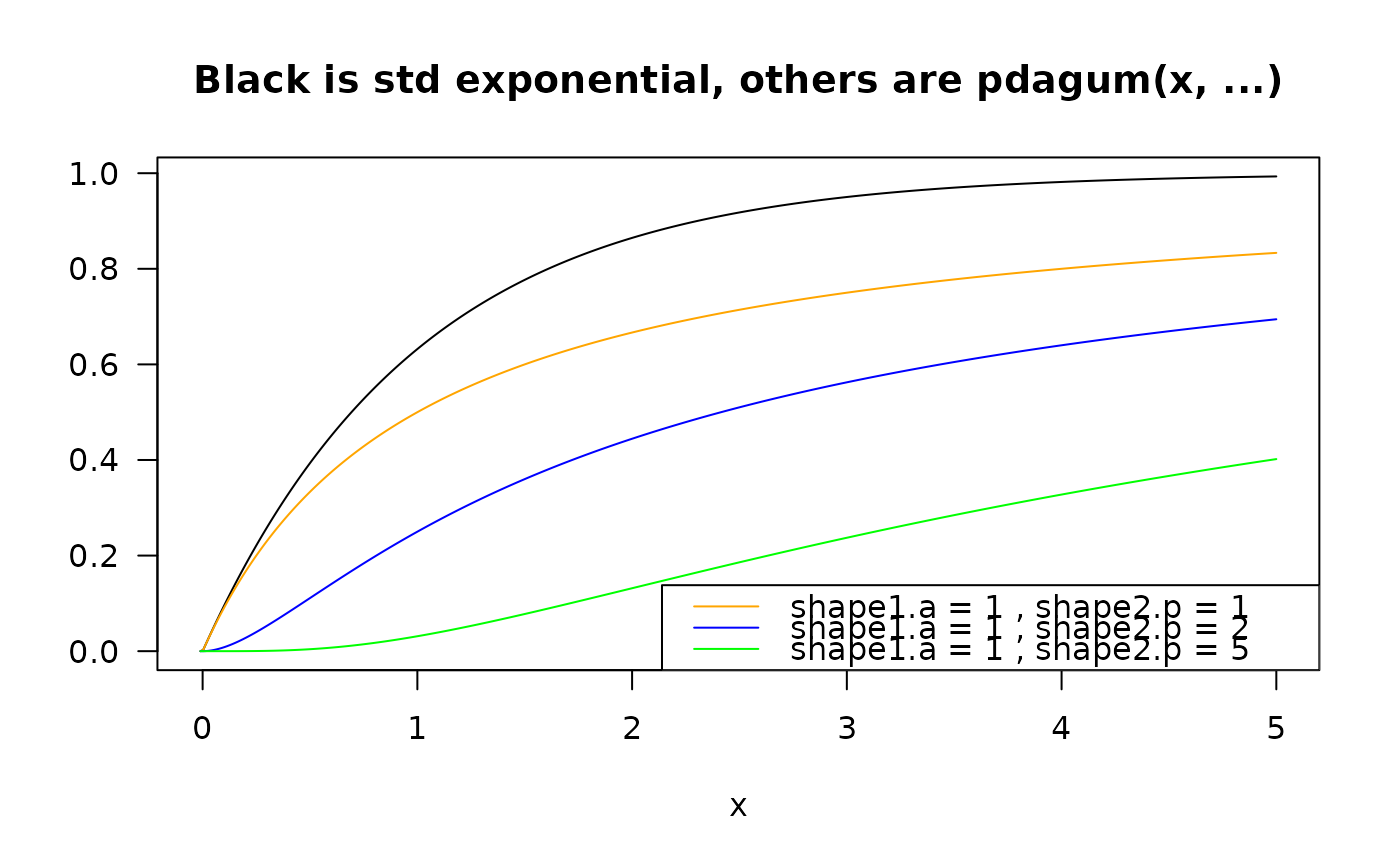
 plot(x, pexp(x), type = "l", col = "black", ylab = "", las = 1,
main = "Black is std exponential, others are pdagum(x, ...)")
lines(x, pdagum(x, shape1.a = shape1.a, shape2.p = 1), col = "orange")
lines(x, pdagum(x, shape1.a = shape1.a, shape2.p = 2), col = "blue")
lines(x, pdagum(x, shape1.a = shape1.a, shape2.p = 5), col = "green")
legend("bottomright", col = c("orange", "blue", "green"),
lty = rep(1, len = 3), legend = paste("shape1.a =", shape1.a,
", shape2.p =", c(1, 2, 5)))
plot(x, pexp(x), type = "l", col = "black", ylab = "", las = 1,
main = "Black is std exponential, others are pdagum(x, ...)")
lines(x, pdagum(x, shape1.a = shape1.a, shape2.p = 1), col = "orange")
lines(x, pdagum(x, shape1.a = shape1.a, shape2.p = 2), col = "blue")
lines(x, pdagum(x, shape1.a = shape1.a, shape2.p = 5), col = "green")
legend("bottomright", col = c("orange", "blue", "green"),
lty = rep(1, len = 3), legend = paste("shape1.a =", shape1.a,
", shape2.p =", c(1, 2, 5)))
 # \dontrun{}