insert an associated plot to left, right, top and bottom of a main plot
insert_left(.data, plot, width = 1)

insert_right(.data, plot, width = 1)

insert_top(.data, plot, height = 1)

insert_bottom(.data, plot, height = 1)
Arguments
Value
an 'aplot' object
Details
The first input serve as a main plot, and other plots can be progressively inserted to different sides on left, right, top and bottom.
Examples
library(ggplot2)
library(aplot)
p <- ggplot(mtcars, aes(mpg, disp)) + geom_point()
p2 <- ggplot(mtcars, aes(mpg)) +
geom_density(fill='steelblue', alpha=.5) +
ggfun::theme_noxaxis()
p3 <- ggplot(mtcars, aes(x=1, y=disp)) +
geom_boxplot(fill='firebrick', alpha=.5) +
theme_void()
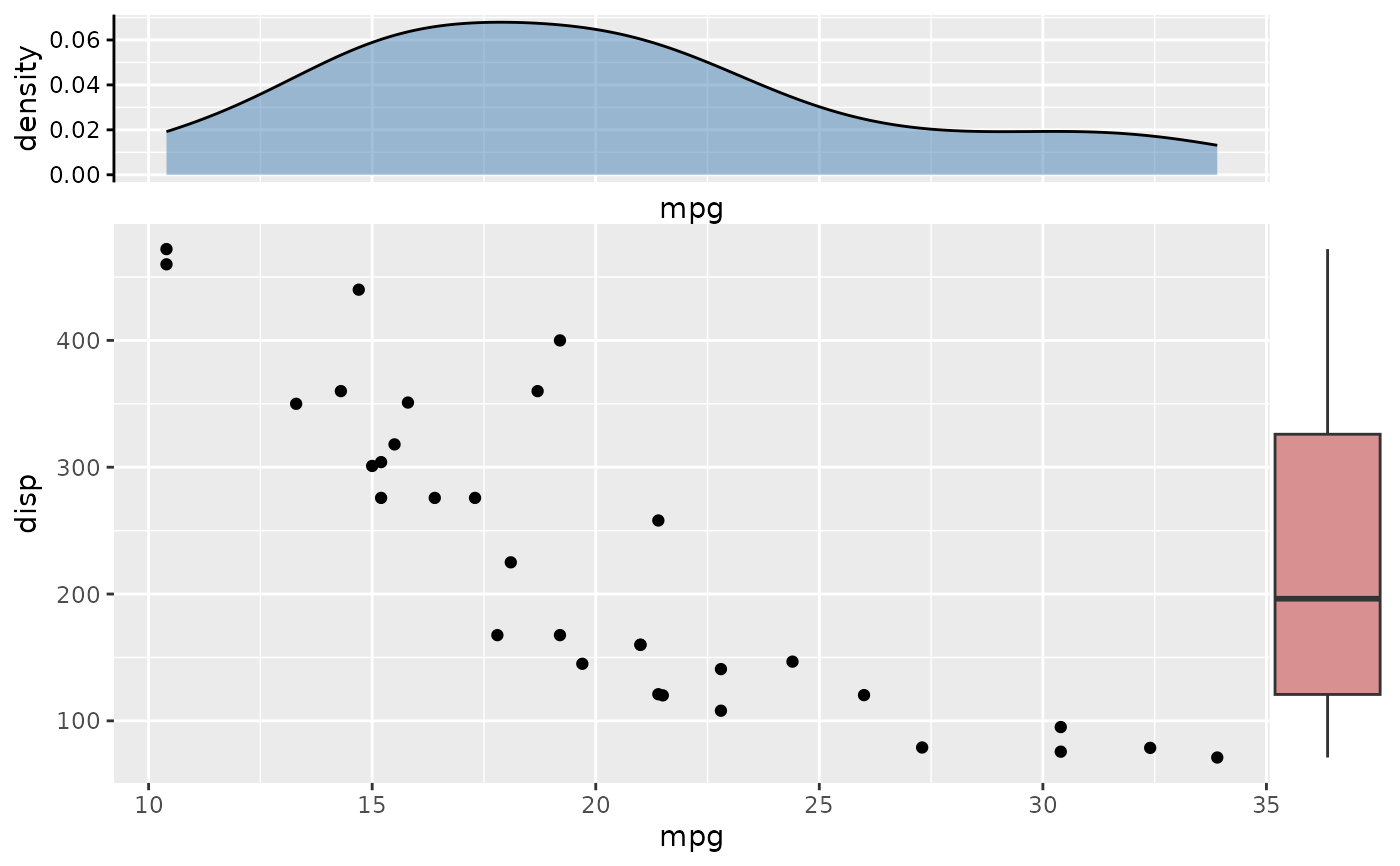
ap <- p %>%
insert_top(p2, height=.3) %>%
insert_right(p3, width=.1)
ap
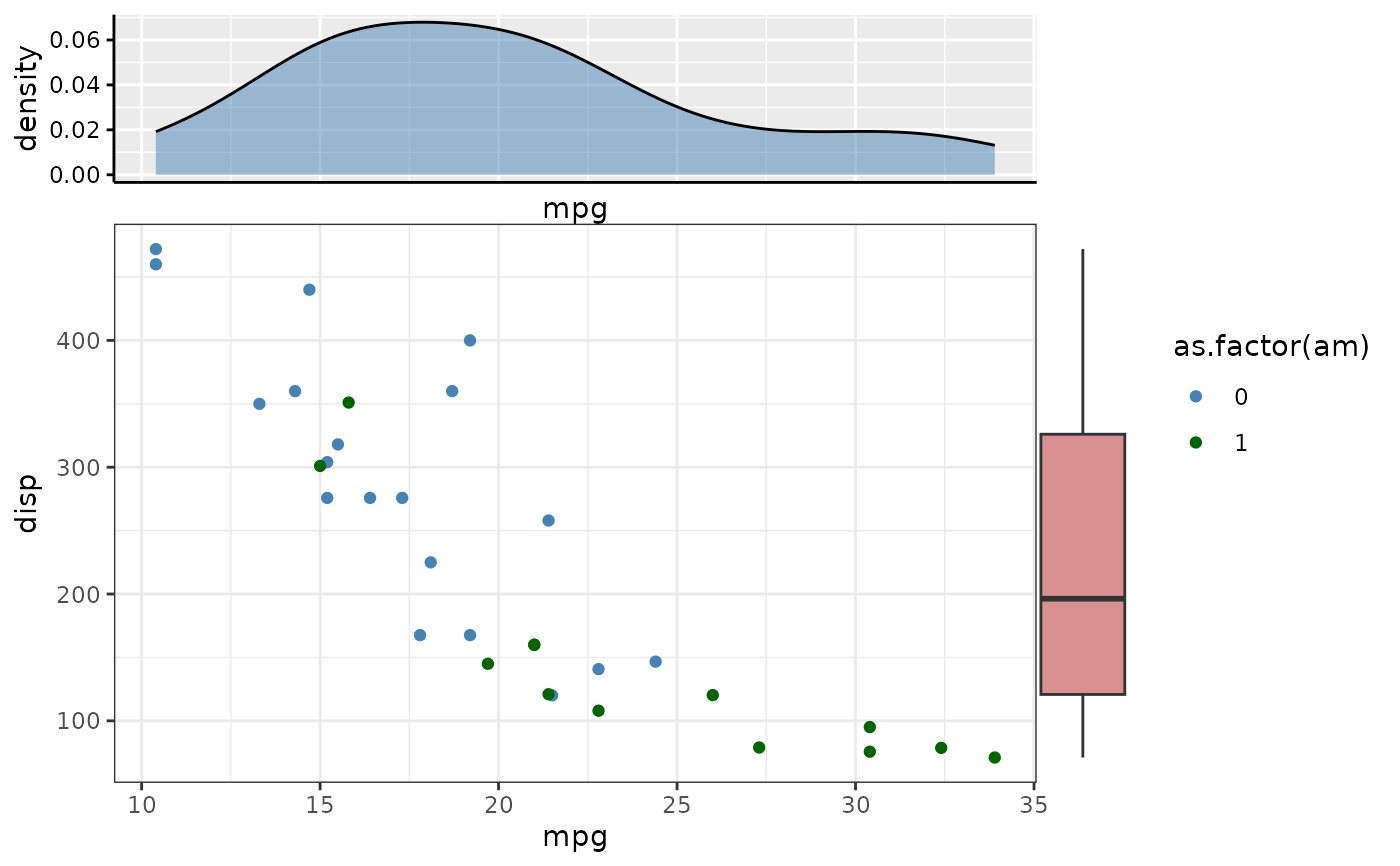
 ap[2, 1] <- ap[2, 1] + theme_bw()
ap[2, 1] <- ap[2, 1] +
aes(color = as.factor(am)) +
scale_color_manual(values = c('steelblue', 'darkgreen'))
ap[1, 1] <- ap[1, 1] + theme(axis.line.x.bottom=element_line())
ap
ap[2, 1] <- ap[2, 1] + theme_bw()
ap[2, 1] <- ap[2, 1] +
aes(color = as.factor(am)) +
scale_color_manual(values = c('steelblue', 'darkgreen'))
ap[1, 1] <- ap[1, 1] + theme(axis.line.x.bottom=element_line())
ap