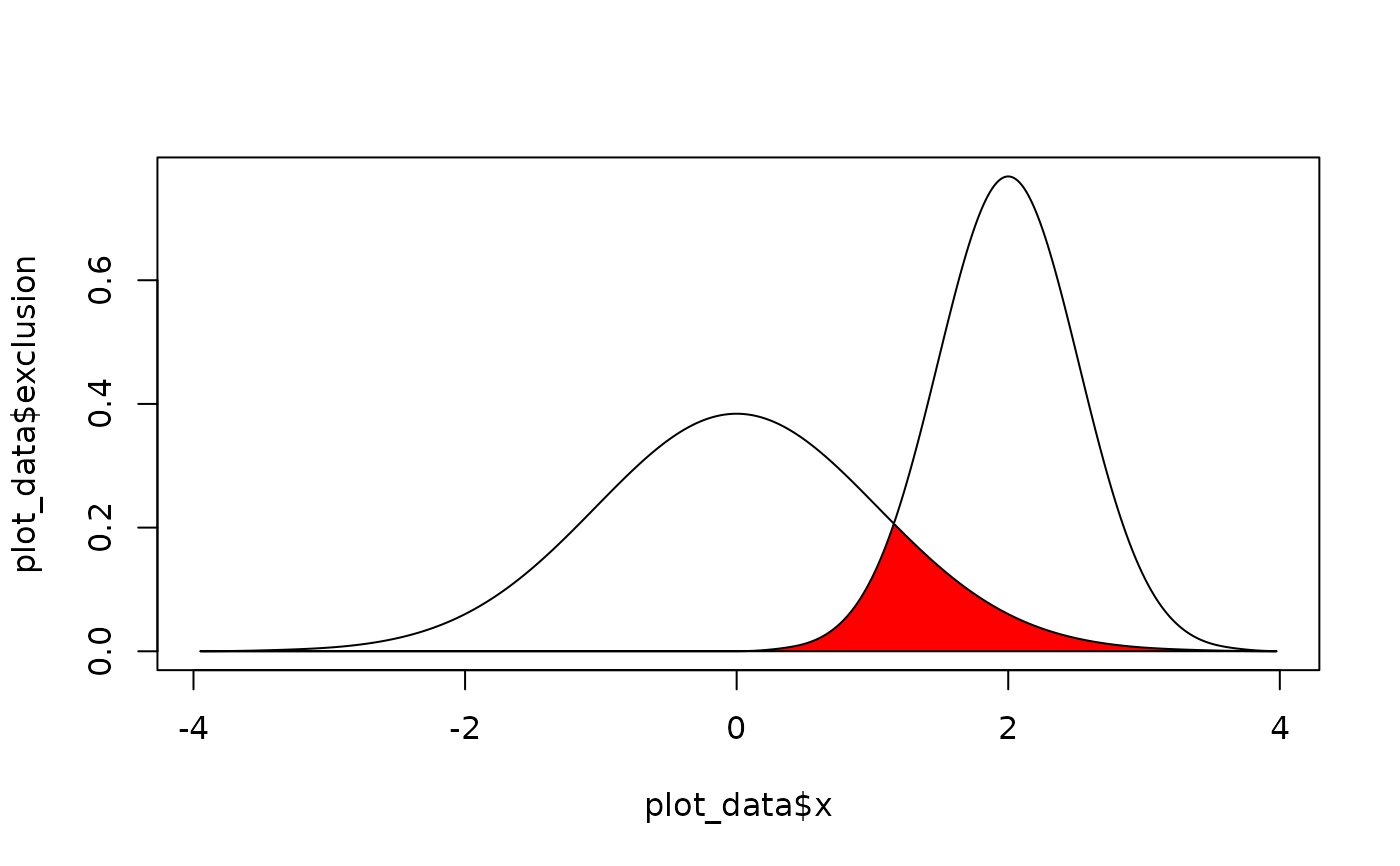
A method to calculate the overlap coefficient between two empirical distributions (that can be used as a measure of similarity between two samples).
overlap(
  x,
  y,
  method_density = "kernel",
  method_auc = "trapezoid",
  precision = 2^10,
  extend = TRUE,
  extend_scale = 0.1,
  ...
)
Arguments
- x
Vector of x values.
- y
Vector of x values.
- method_density
Density estimation method. See
estimate_density().- method_auc
Area Under the Curve (AUC) estimation method. See
area_under_curve().- precision
Number of points of density data. See the
nparameter indensity.- extend
Extend the range of the x axis by a factor of
extend_scale.- extend_scale
Ratio of range by which to extend the x axis. A value of
0.1means that the x axis will be extended by1/10of the range of the data.- ...
Currently not used.
Examples
library(bayestestR)

x <- distribution_normal(1000, 2, 0.5)
y <- distribution_normal(1000, 0, 1)

overlap(x, y)
#> # Overlap
#>
#> 18.6%
plot(overlap(x, y))