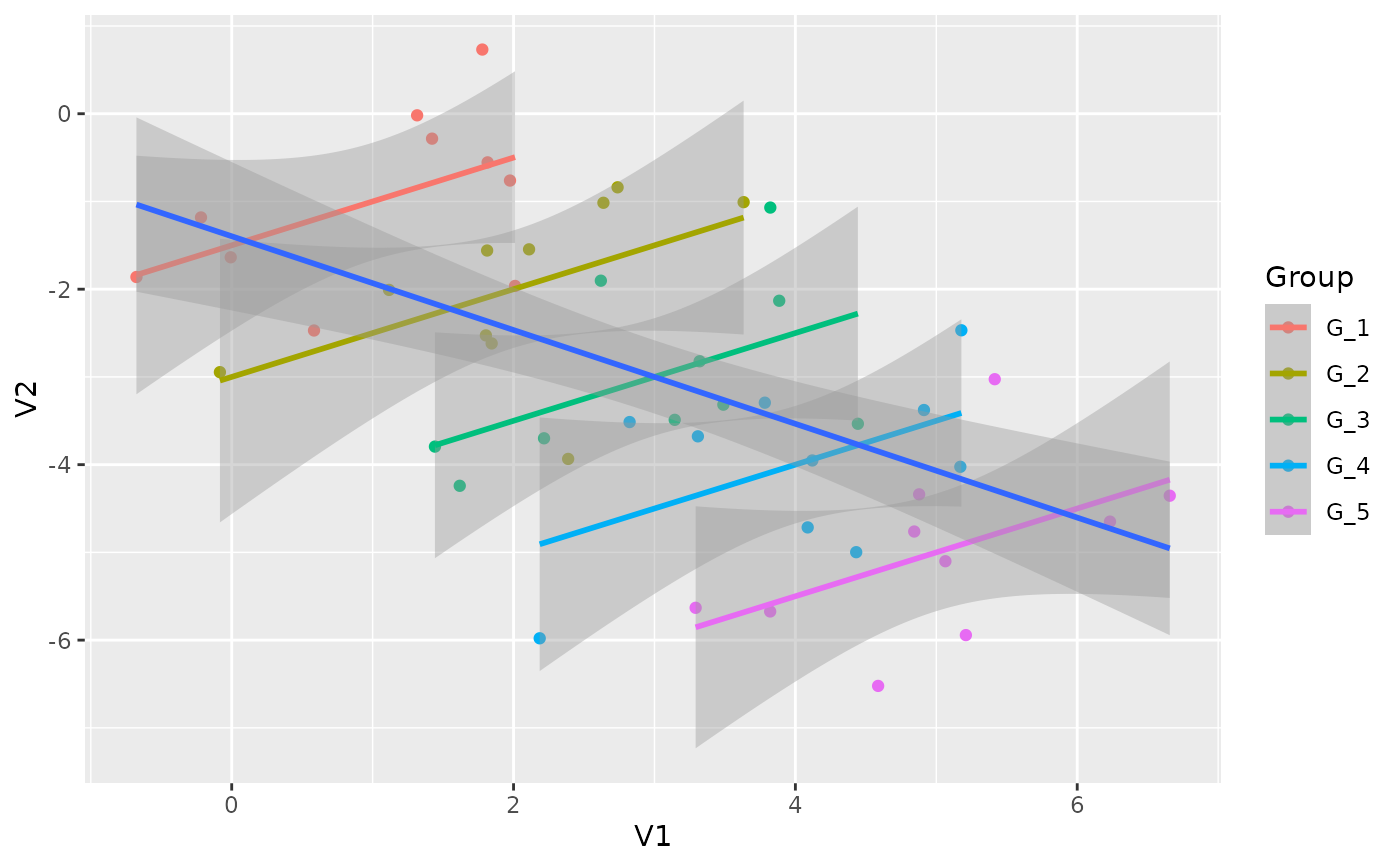
Simpson's paradox, or the Yule-Simpson effect, is a phenomenon in probability and statistics, in which a trend appears in several different groups of data but disappears or reverses when these groups are combined.
simulate_simpson(
  n = 100,
  r = 0.5,
  groups = 3,
  difference = 1,
  group_prefix = "G_"
)
Arguments
- n
The number of observations for each group to be generated (minimum 4).
- r
A value or vector corresponding to the desired correlation coefficients.
- groups
Number of groups (groups can be participants, clusters, anything).
- difference
Difference between groups.
- group_prefix
The prefix of the group name (e.g., "G_1", "G_2", "G_3", ...).
Value
A dataset.
Examples
data <- simulate_simpson(n = 10, groups = 5, r = 0.5)

if (require("ggplot2")) {
  ggplot(data, aes(x = V1, y = V2)) +
    geom_point(aes(color = Group)) +
    geom_smooth(aes(color = Group), method = "lm") +
    geom_smooth(method = "lm")
}
#> Loading required package: ggplot2
#> `geom_smooth()` using formula = 'y ~ x'
#> `geom_smooth()` using formula = 'y ~ x'