Read and Write Images in GIF format
GIF.RdRead and write files in GIF format. Files can contain single images or multiple frames. Multi-frame images are saved as animated GIF's.
read.gif(filename, frame=0, flip=FALSE, verbose=FALSE)
write.gif(image, filename, col="gray", scale=c("smart", "never", "always"),
    transparent=NULL, comment=NULL, delay=0, flip=FALSE, interlace=FALSE)
Arguments
- filename
Character string with name of the file. In case of
read.gifURL's are also allowed.- image
Data to be saved as GIF file. Can be a 2D matrix or 3D array. Allowed formats in order of preference:
array of integers in [0:255] range - this is format required by GIF file, and unless
scale='always', numbers will not be rescaled. Each pixeliwill have associated colorcol[image[i]+1]. This is the only format that can be safely used with non-continuous color maps.array of doubles in [0:1] range - Unless
scale='never'the array will be multiplied by 255 and rounded.array of numbers in any range - will be scaled or clipped depending on
scaleoption.
- frame
Request specific frame from multiframe (i.e., animated) GIF file. By default all frames are read from the file (
frame=0). Settingframe=1will ensure that output is always a 2D matrix containing the first frame. Some files have to be read frame by frame, for example: files with subimages of different sizes and files with both global and local color-maps (palettes).- col
Color palette definition. Several formats are allowed:
array (list) of colors in the same format as output of palette functions. Preferred format for precise color control.
palette function itself (ex. '
col=rainbow'). Preferred format if not sure how many colors are needed.character string with name of internally defined palette. At the moment only "gray" and "jet" (Matlab's jet palette) are defined.
character string with name of palette function (ex. '
col="rainbow"')
Usually palette will consist of 256 colors, which is the maximum allowed by GIF format. By default, grayscale will be used.
- scale
There are three approaches to rescaling the data to required [0, 255] integer range:
"smart" - Data is fitted to [0:255] range, only if it falls outside of it. Also, if
imageis an array of doubles in range [0, 1] than data is multiplied by 255."never" - Pixels with intensities outside of the allowed range are clipped to either 0 or 255. Warning is given.
"always" - Data is always rescaled. If
imageis a array of doubles in range [0, 1] than data is multiplied by 255; otherwise it is scaled to fit to [0:255] range.
- delay
In case of 3D arrays the data will be stored as animated GIF, and
delaycontrols speed of the animation. It is number of hundredths (1/100) of a second of delay between frames.- comment
Comments in text format are allowed in GIF files. Few file viewers can access them.
- flip
By default data is stored in the same orientation as data displayed by
printfunction: row 1 is on top, image x-axis corresponds to columns and y-axis corresponds to rows. However functionimageadopted different standard: column 1 is on the bottom, image x-axis corresponds to rows and y-axis corresponds to columns. SetfliptoTRUEto get the orientation used byimage.- transparent
Optional color number to be shown as transparent. Has to be an integer in [0:255] range. NA's in the
imagewill be set to transparent.- interlace
GIF files allow image rows to be
interlaced, or reordered in such a way as to allow viewer to display image using 4 passes, making image sharper with each pass. Irrelevant feature on fast computers.- verbose
Display details sections encountered while reading GIF file.
Details
Palettes often contain continuous colors, such that swapping palettes or
rescaling of the image date does not affect image apperance in a drastic way.
However, when working with non-continuous color-maps one should always provide
image in [0:255] integer range (and set scale="never"), in order to
prevent scaling.
If NA or other infinite numbers are found in the image by
write.gif, they will be converted to numbers given by transparent.
If transparent color is not provided than it will be created, possibly
after reshretching.
There are some GIF files not fully supported by read.gif function:
"Plain Text Extension" is not supported, and will be ignored.
Multi-frame files with unique settings for each frame have to be read frame by frame. Possible settings include: frames with different sizes, frames using local color maps and frames using individual transparency colors.
Value
Function write.gif does not return anything.
Function read.gif returns a list with following fields:
- image
matrix or 3D array of integers in [0:255] range.
- col
color palette definitions with number of colors ranging from 1 to 256. In case when
frame=0only the first (usually global) color-map (palette) is returned.- comment
Comments imbedded in GIF File
- transparent
color number corresponding to transparent color. If none was stated than NULL, otherwise an integer in [0:255] range. In order for
graphics:imageto display transparent colors correctly one should usey$col[y$transparent+1] = NA.
See also
Displaying of images can be done through functions:
graphics:image (part of R),
fields::image.plot and fields::add.image or
spatstat:plot.im, and possibly many other functions.
Displayed image can be saved in GIF, JPEG or PNG format using several
different functions, like R2HTML:HTMLplot.
Functions for directly reading and writing image files:
read.pnmandpixmap::write.pnmcan process PBM, PGM and PPM images (file types supported by ImageMagic software)read.ENVIandwrite.ENVIfrom this package can process files in ENVI format. ENVI files can store 2D images and 3D data (multi-frame images), and are supported by most GIS (Geographic Information System) software including free "freelook".
There are many functions for creating and managing color palettes:
fields::tim.colorscontains a palette similar to Matlab's jet palette (see examples for simpler implementation)gplots::rich.colorscontains two palettes of continuous colors.Functions
RColorBrewer::brewer.palandepitools::colorbrewer.palettecontain tools for generating palettes.grDevices::rgbandgrDevices::hsvcreate palette from RGB or HSV 3-vectors.grDevices::col2rgbtranslates palette colors to RGB 3-vectors.
References
Ziv, J., Lempel, A. (1977) An Universal Algorithm for Sequential Data Compression, IEEE Transactions on Information Theory, May 1977.
Examples
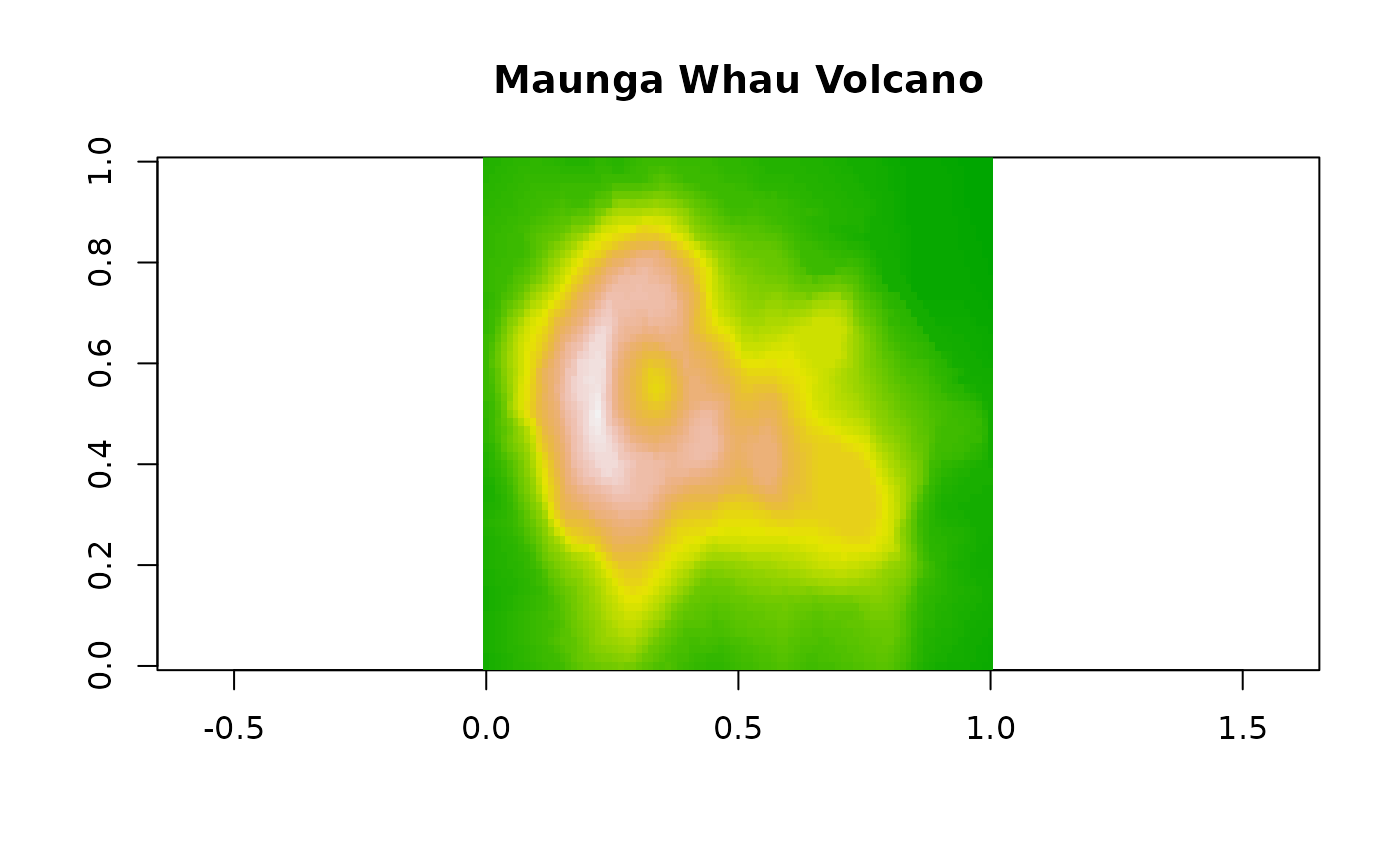
# visual comparison between image and plot
write.gif( volcano, "volcano.gif", col=terrain.colors, flip=TRUE,
scale="always", comment="Maunga Whau Volcano")
y = read.gif("volcano.gif", verbose=TRUE, flip=TRUE)
#> GIF image header
#> Global colormap with 256 colors
#> Comment Extension
#> Image [61 x 87]: 3585 bytes
#> GIF Terminator
#>
image(y$image, col=y$col, main=y$comment, asp=1)
 # browseURL("file://volcano.gif") # inspect GIF file on your hard disk
# test reading & writing
col = heat.colors(256) # choose colormap
trn = 222 # set transparent color
com = "Hello World" # imbed comment in the file
write.gif( volcano, "volcano.gif", col=col, transparent=trn, comment=com)
y = read.gif("volcano.gif")
# This tested col==y$col, but colours may or may not have an alpha channel
# and for col this changed in R 4.0
stopifnot(volcano==y$image, trn==y$transparent, com==y$comment)
# browseURL("file://volcano.gif") # inspect GIF file on your hard disk
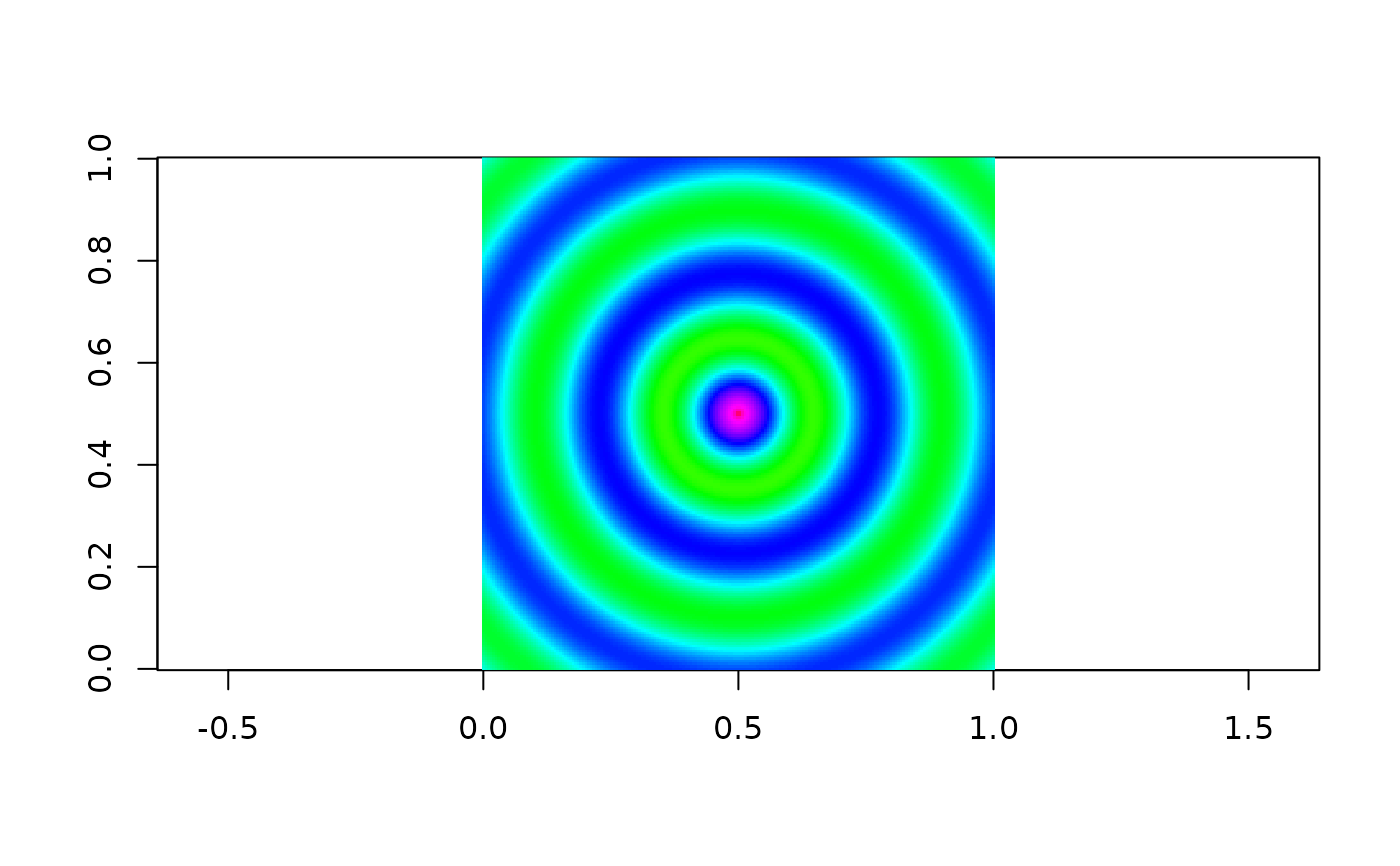
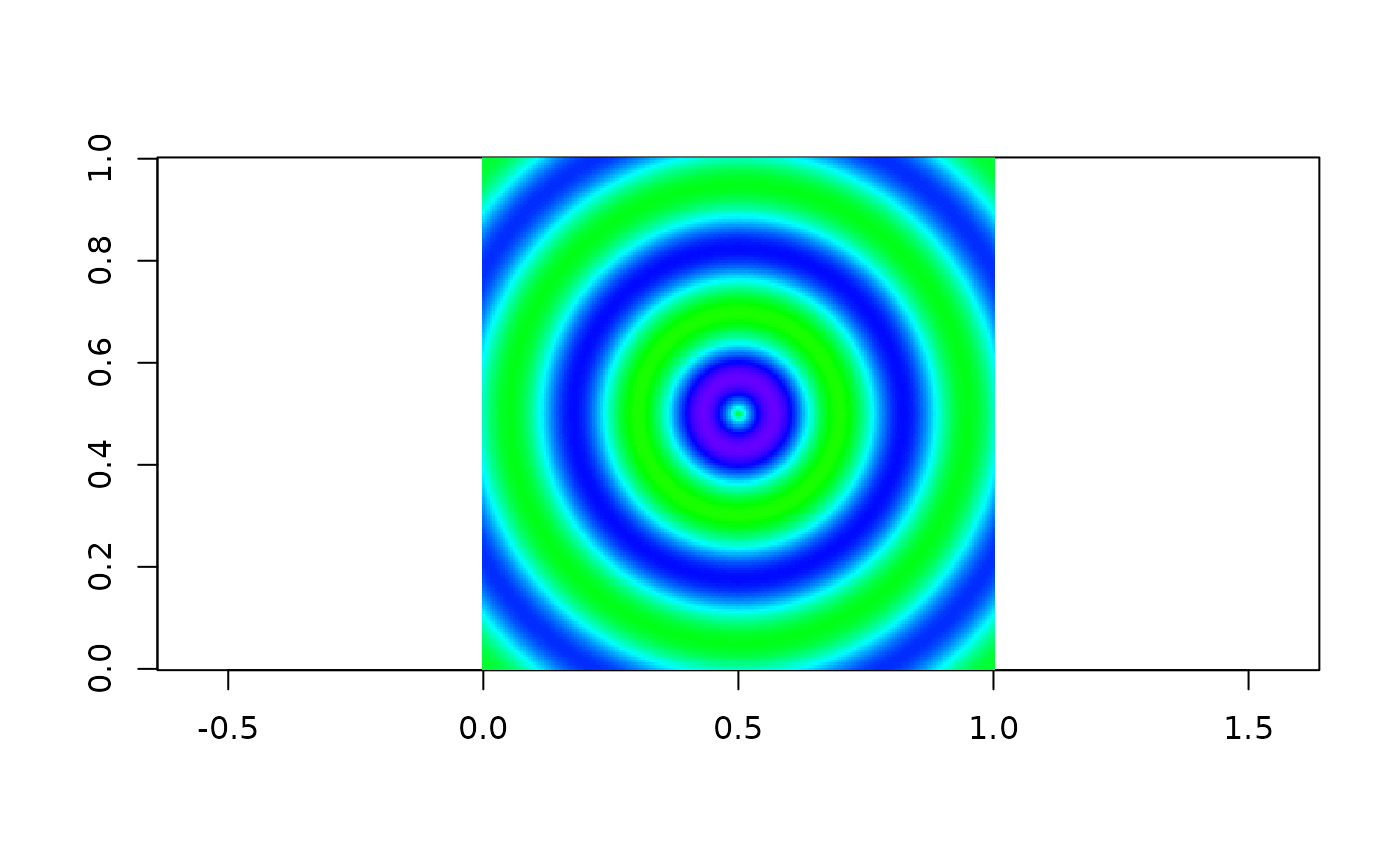
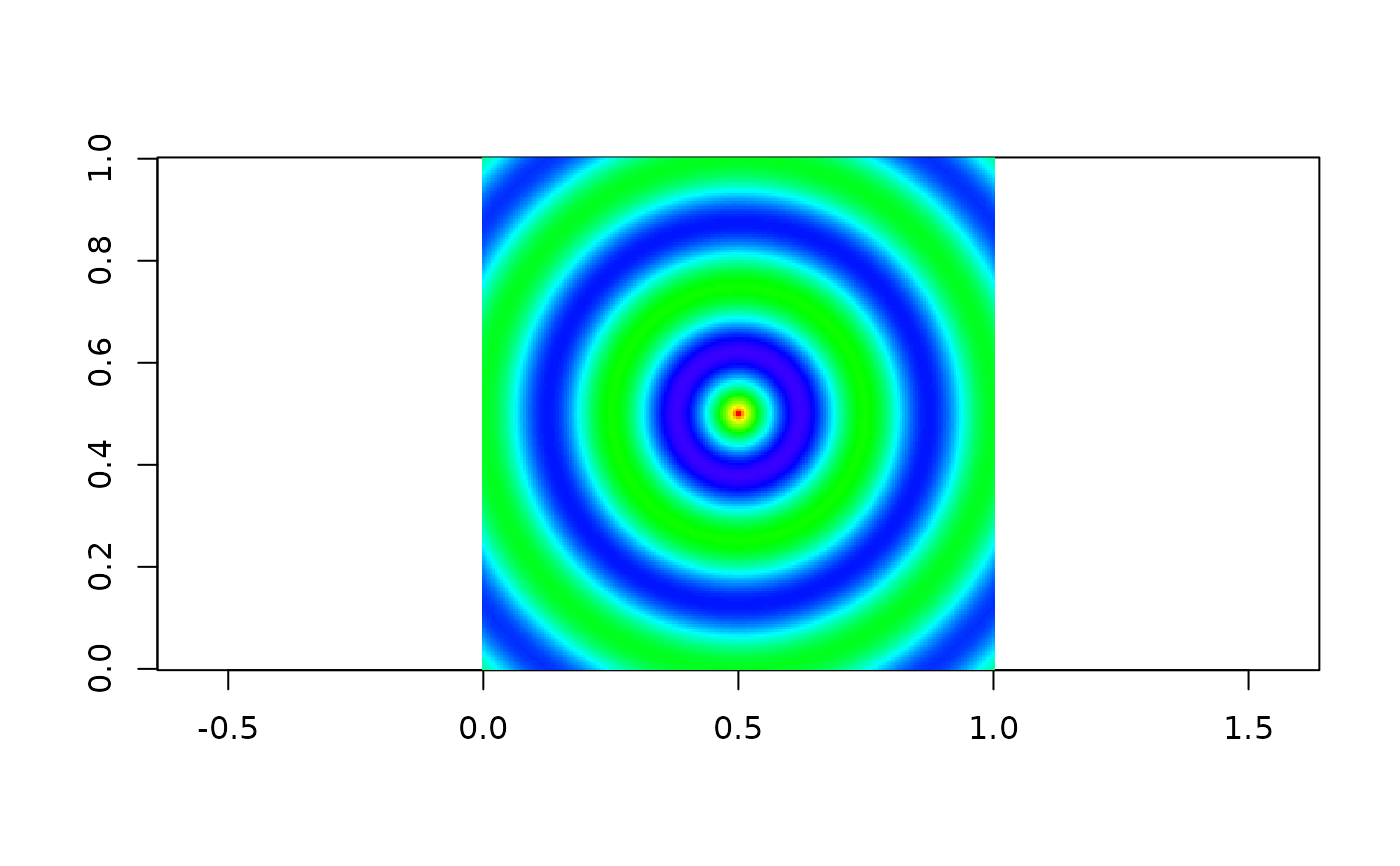
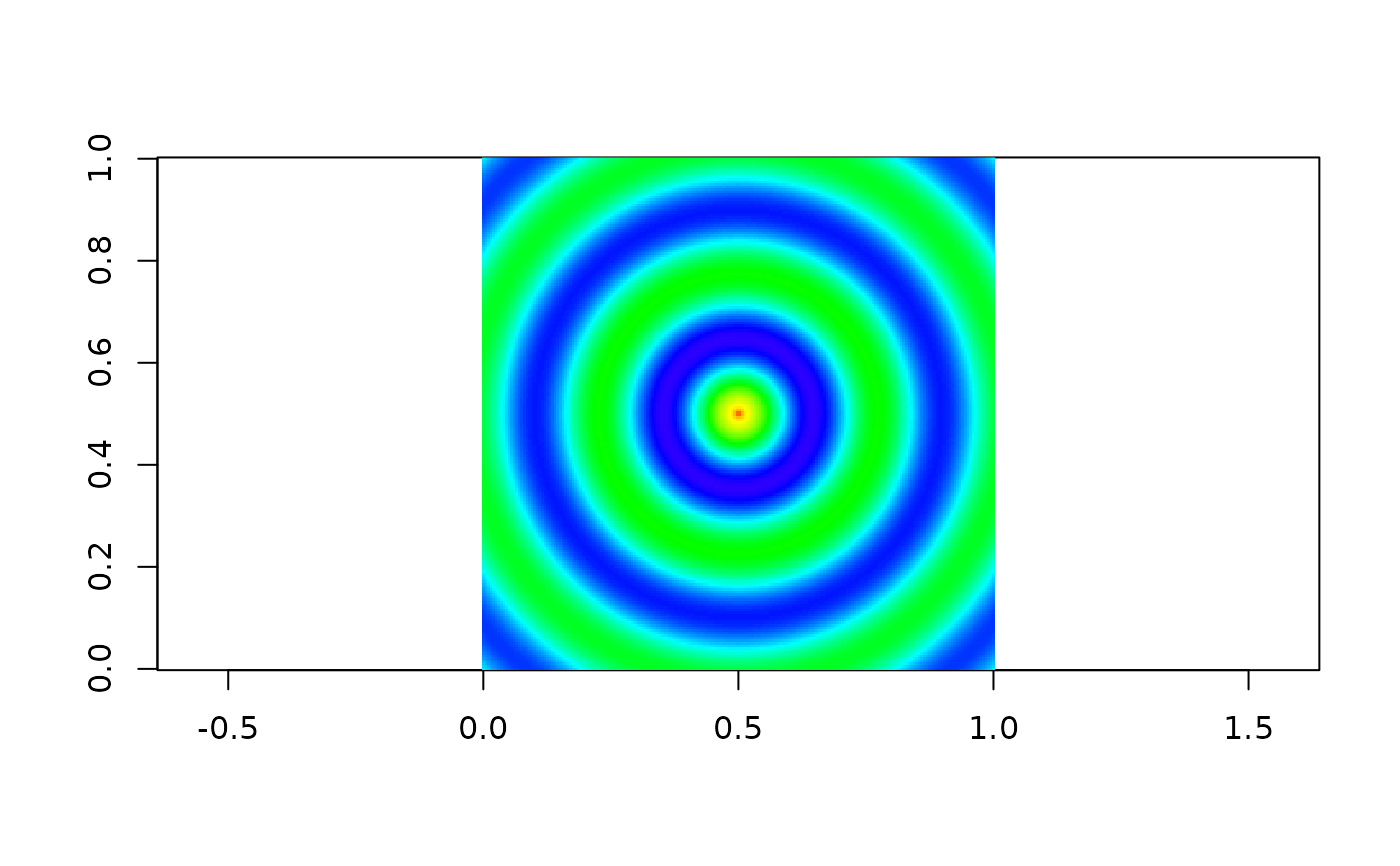
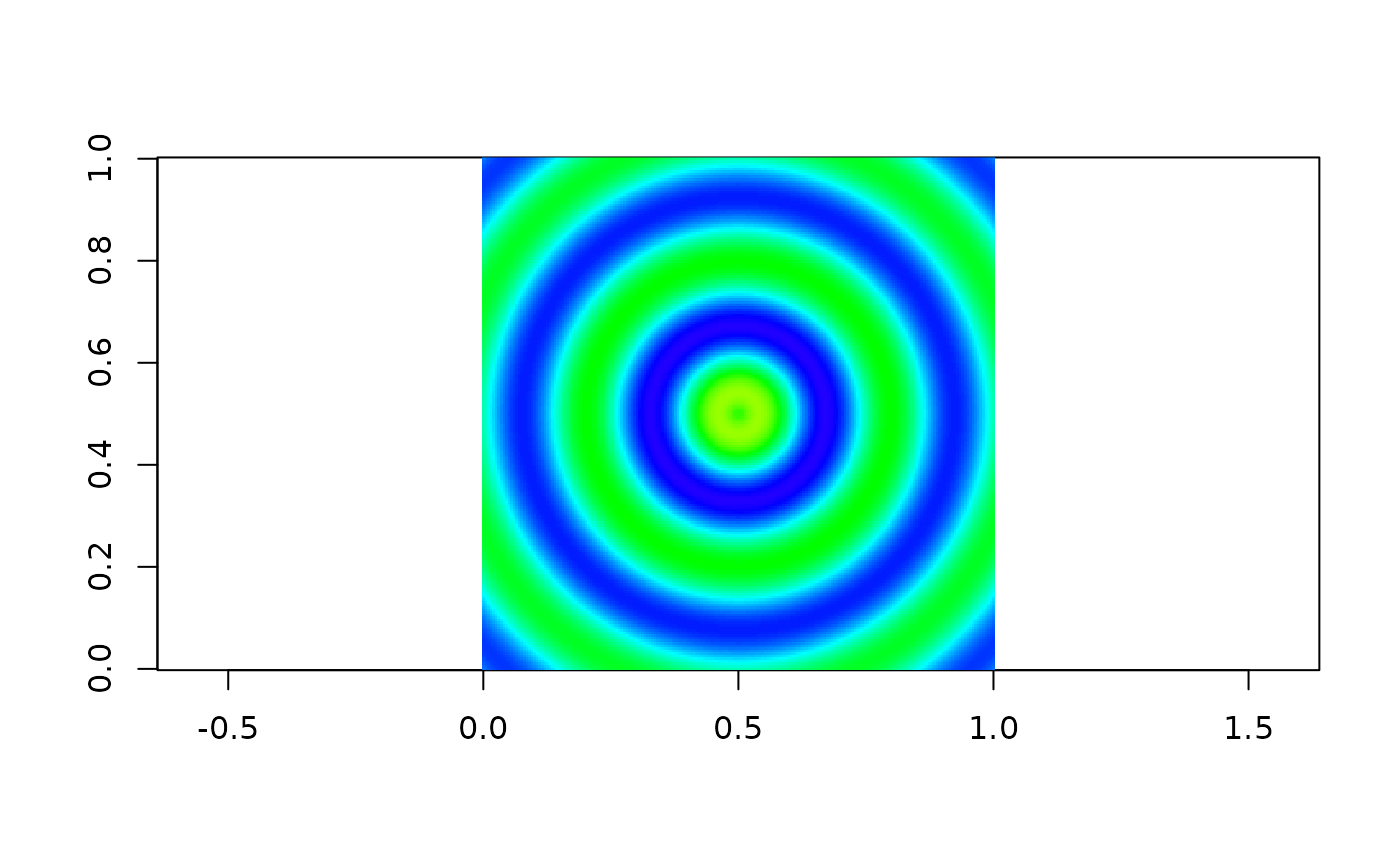
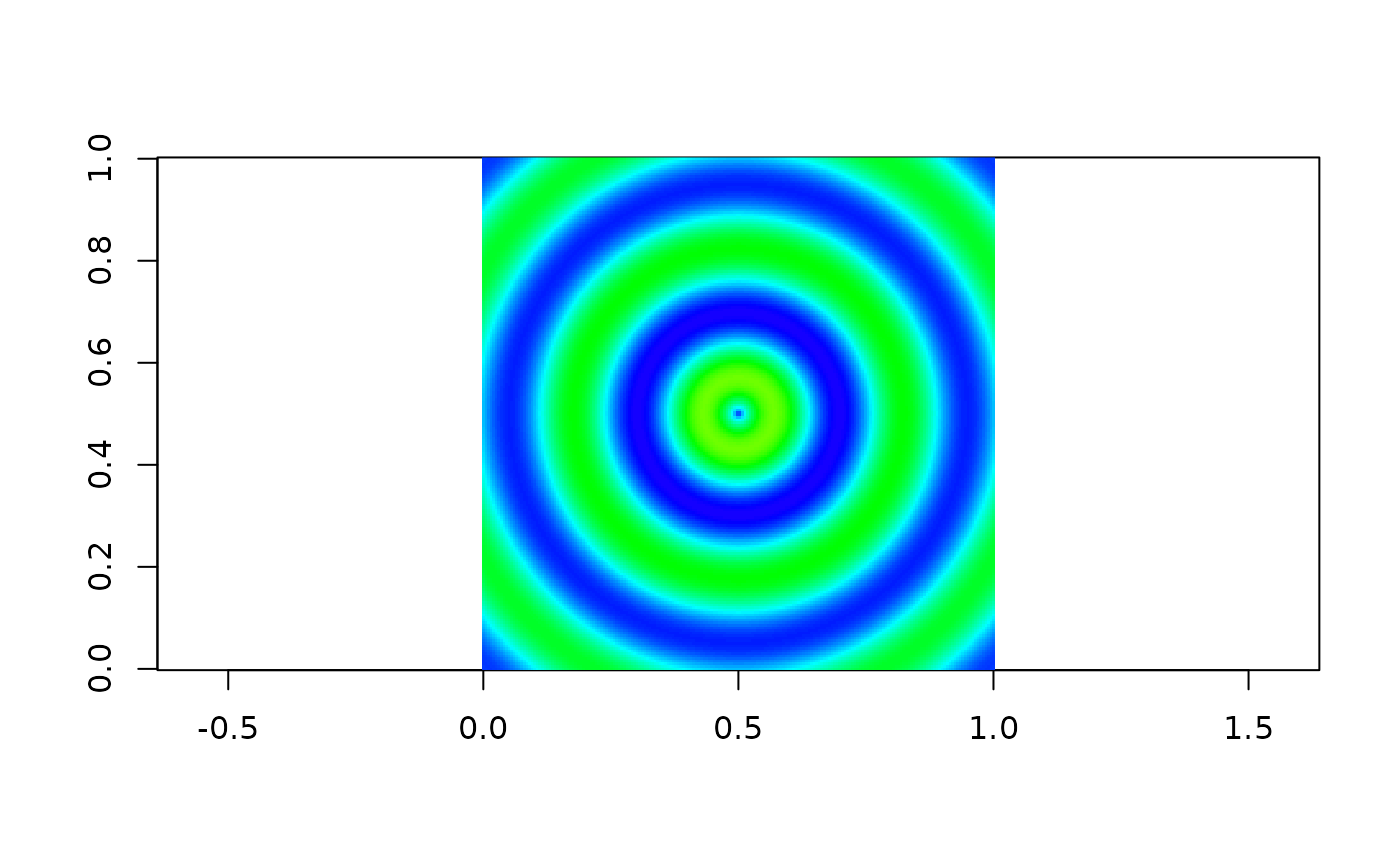
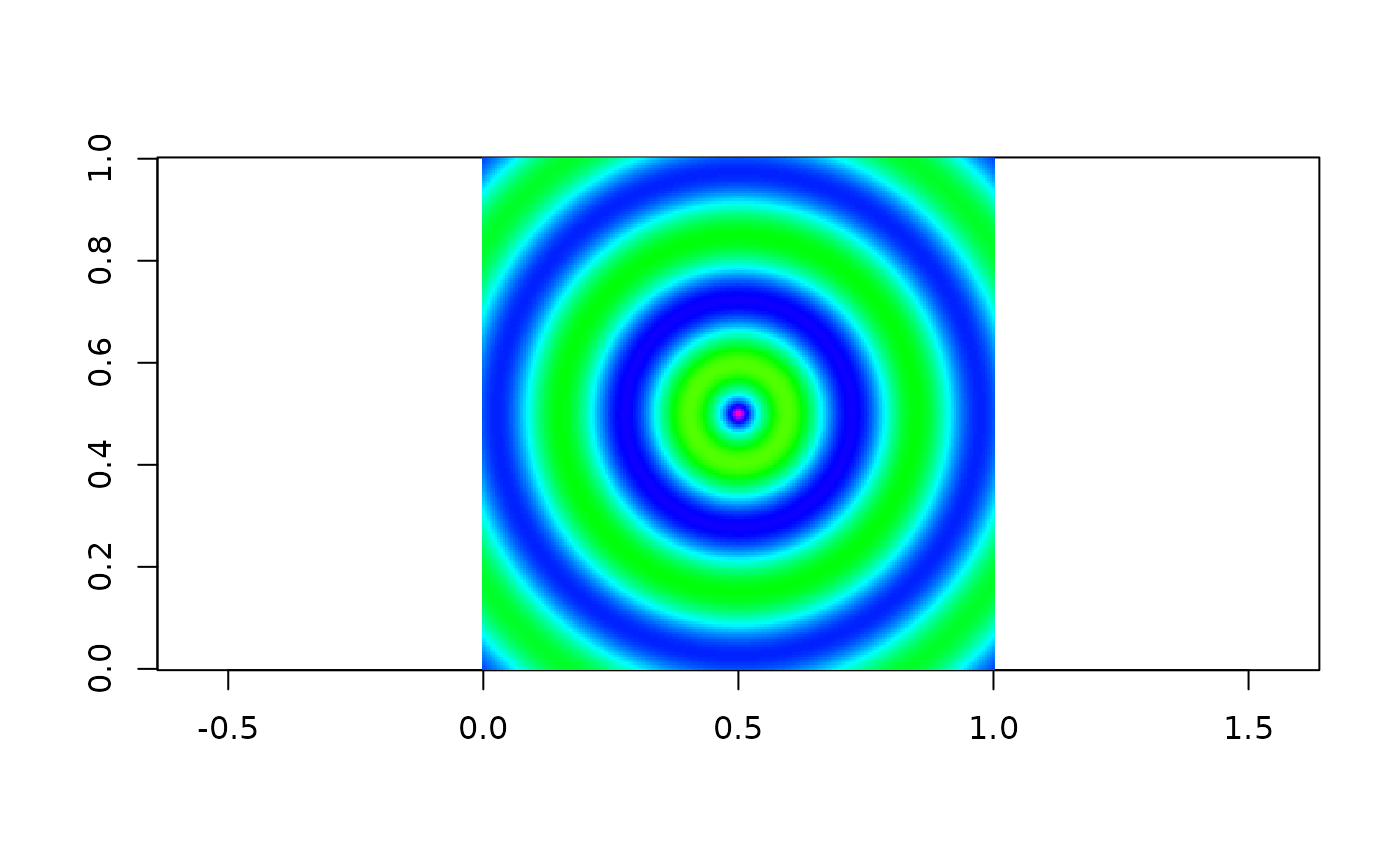
# create simple animated GIF (using image function in a loop is very rough,
# but only way I know of displaying 'animation" in R)
x <- y <- seq(-4*pi, 4*pi, len=200)
r <- sqrt(outer(x^2, y^2, "+"))
image = array(0, c(200, 200, 10))
for(i in 1:10) image[,,i] = cos(r-(2*pi*i/10))/(r^.25)
write.gif(image, "wave.gif", col="rainbow")
y = read.gif("wave.gif")
for(i in 1:10) image(y$image[,,i], col=y$col, breaks=(0:256)-0.5, asp=1)
# browseURL("file://volcano.gif") # inspect GIF file on your hard disk
# test reading & writing
col = heat.colors(256) # choose colormap
trn = 222 # set transparent color
com = "Hello World" # imbed comment in the file
write.gif( volcano, "volcano.gif", col=col, transparent=trn, comment=com)
y = read.gif("volcano.gif")
# This tested col==y$col, but colours may or may not have an alpha channel
# and for col this changed in R 4.0
stopifnot(volcano==y$image, trn==y$transparent, com==y$comment)
# browseURL("file://volcano.gif") # inspect GIF file on your hard disk
# create simple animated GIF (using image function in a loop is very rough,
# but only way I know of displaying 'animation" in R)
x <- y <- seq(-4*pi, 4*pi, len=200)
r <- sqrt(outer(x^2, y^2, "+"))
image = array(0, c(200, 200, 10))
for(i in 1:10) image[,,i] = cos(r-(2*pi*i/10))/(r^.25)
write.gif(image, "wave.gif", col="rainbow")
y = read.gif("wave.gif")
for(i in 1:10) image(y$image[,,i], col=y$col, breaks=(0:256)-0.5, asp=1)


 # browseURL("file://wave.gif") # inspect GIF file on your hard disk
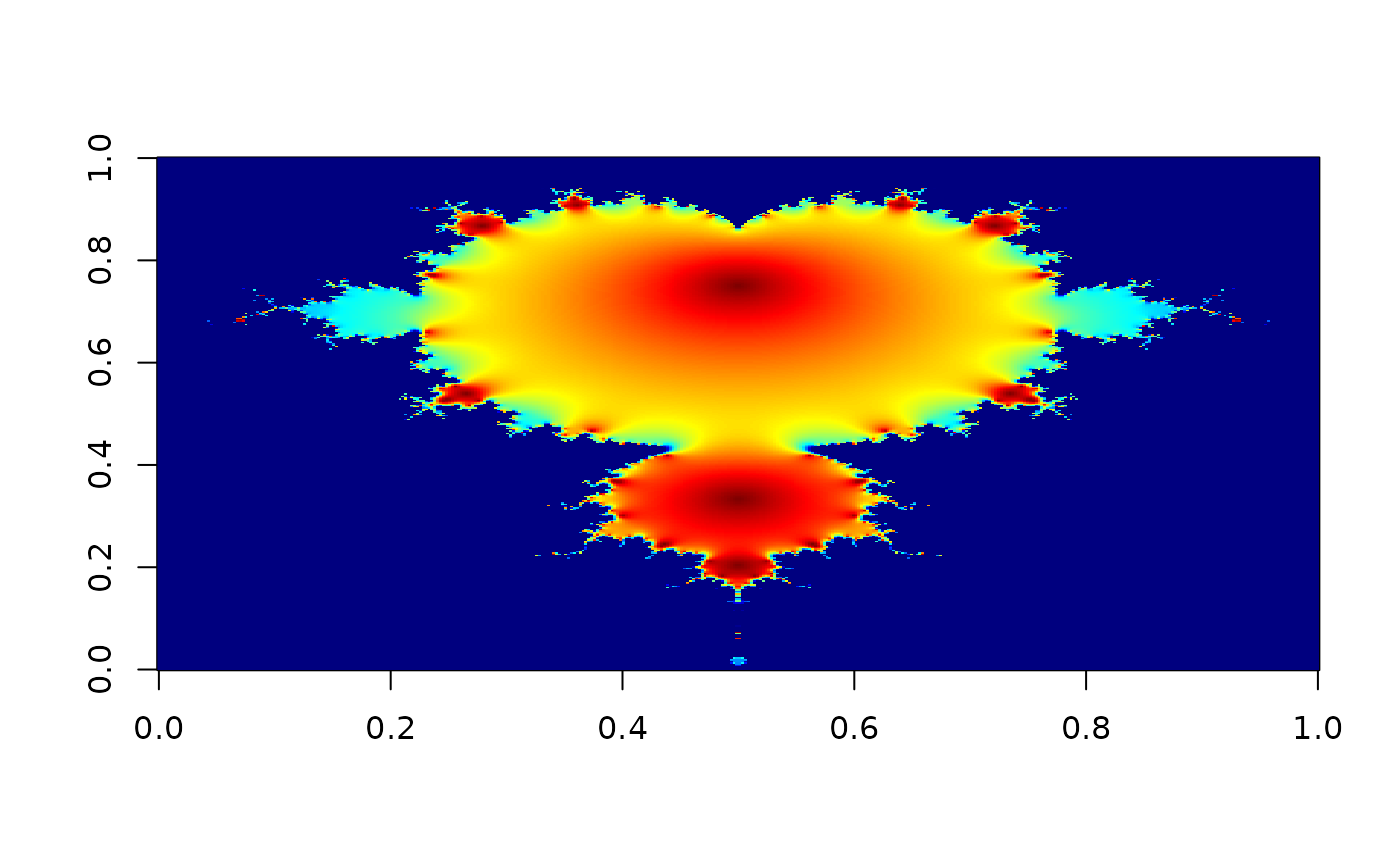
# Another neat animation of Mandelbrot Set
jet.colors = colorRampPalette(c("#00007F", "blue", "#007FFF", "cyan", "#7FFF7F",
"yellow", "#FF7F00", "red", "#7F0000")) # define "jet" palette
m = 400
C = complex( real=rep(seq(-1.8,0.6, length.out=m), each=m ),
imag=rep(seq(-1.2,1.2, length.out=m), m ) )
C = matrix(C,m,m)
Z = 0
X = array(0, c(m,m,20))
for (k in 1:20) {
Z = Z^2+C
X[,,k] = exp(-abs(Z))
}
image(X[,,k], col=jet.colors(256))
# browseURL("file://wave.gif") # inspect GIF file on your hard disk
# Another neat animation of Mandelbrot Set
jet.colors = colorRampPalette(c("#00007F", "blue", "#007FFF", "cyan", "#7FFF7F",
"yellow", "#FF7F00", "red", "#7F0000")) # define "jet" palette
m = 400
C = complex( real=rep(seq(-1.8,0.6, length.out=m), each=m ),
imag=rep(seq(-1.2,1.2, length.out=m), m ) )
C = matrix(C,m,m)
Z = 0
X = array(0, c(m,m,20))
for (k in 1:20) {
Z = Z^2+C
X[,,k] = exp(-abs(Z))
}
image(X[,,k], col=jet.colors(256))
 write.gif(X, "Mandelbrot.gif", col=jet.colors, delay=100)
# browseURL("file://Mandelbrot.gif") # inspect GIF file on your hard disk
file.remove("wave.gif", "volcano.gif", "Mandelbrot.gif")
#> [1] TRUE TRUE TRUE
# Display interesting images from the web
if (FALSE) { # \dontrun{
url = "http://www.ngdc.noaa.gov/seg/cdroms/ged_iib/datasets/b12/gifs/eccnv.gif"
y = read.gif(url, verbose=TRUE, flip=TRUE)
image(y$image, col=y$col, breaks=(0:length(y$col))-0.5, asp=1,
main="January Potential Evapotranspiration mm/mo")
url = "http://www.ngdc.noaa.gov/seg/cdroms/ged_iib/datasets/b01/gifs/fvvcode.gif"
y = read.gif(url, flip=TRUE)
y$col[y$transparent+1] = NA # mark transparent color in R way
image(y$image, col=y$col[1:87], breaks=(0:87)-0.5, asp=1,
main="Vegetation Types")
url = "http://talc.geo.umn.edu/people/grads/hasba002/erosion_vids/run2/r2_dems_5fps(8color).gif"
y = read.gif(url, verbose=TRUE, flip=TRUE)
for(i in 2:dim(y$image)[3])
image(y$image[,,i], col=y$col, breaks=(0:length(y$col))-0.5,
asp=1, main="Erosion in Drainage Basins")
} # }
write.gif(X, "Mandelbrot.gif", col=jet.colors, delay=100)
# browseURL("file://Mandelbrot.gif") # inspect GIF file on your hard disk
file.remove("wave.gif", "volcano.gif", "Mandelbrot.gif")
#> [1] TRUE TRUE TRUE
# Display interesting images from the web
if (FALSE) { # \dontrun{
url = "http://www.ngdc.noaa.gov/seg/cdroms/ged_iib/datasets/b12/gifs/eccnv.gif"
y = read.gif(url, verbose=TRUE, flip=TRUE)
image(y$image, col=y$col, breaks=(0:length(y$col))-0.5, asp=1,
main="January Potential Evapotranspiration mm/mo")
url = "http://www.ngdc.noaa.gov/seg/cdroms/ged_iib/datasets/b01/gifs/fvvcode.gif"
y = read.gif(url, flip=TRUE)
y$col[y$transparent+1] = NA # mark transparent color in R way
image(y$image, col=y$col[1:87], breaks=(0:87)-0.5, asp=1,
main="Vegetation Types")
url = "http://talc.geo.umn.edu/people/grads/hasba002/erosion_vids/run2/r2_dems_5fps(8color).gif"
y = read.gif(url, verbose=TRUE, flip=TRUE)
for(i in 2:dim(y$image)[3])
image(y$image[,,i], col=y$col, breaks=(0:length(y$col))-0.5,
asp=1, main="Erosion in Drainage Basins")
} # }