Plots the mean of the response for two-way combinations of factors, thereby illustrating possible interactions.
interaction_plot(.data, .formula, interval = "conf.int")Arguments
Note
This is a recent addition to the package and is subject to change.
Examples
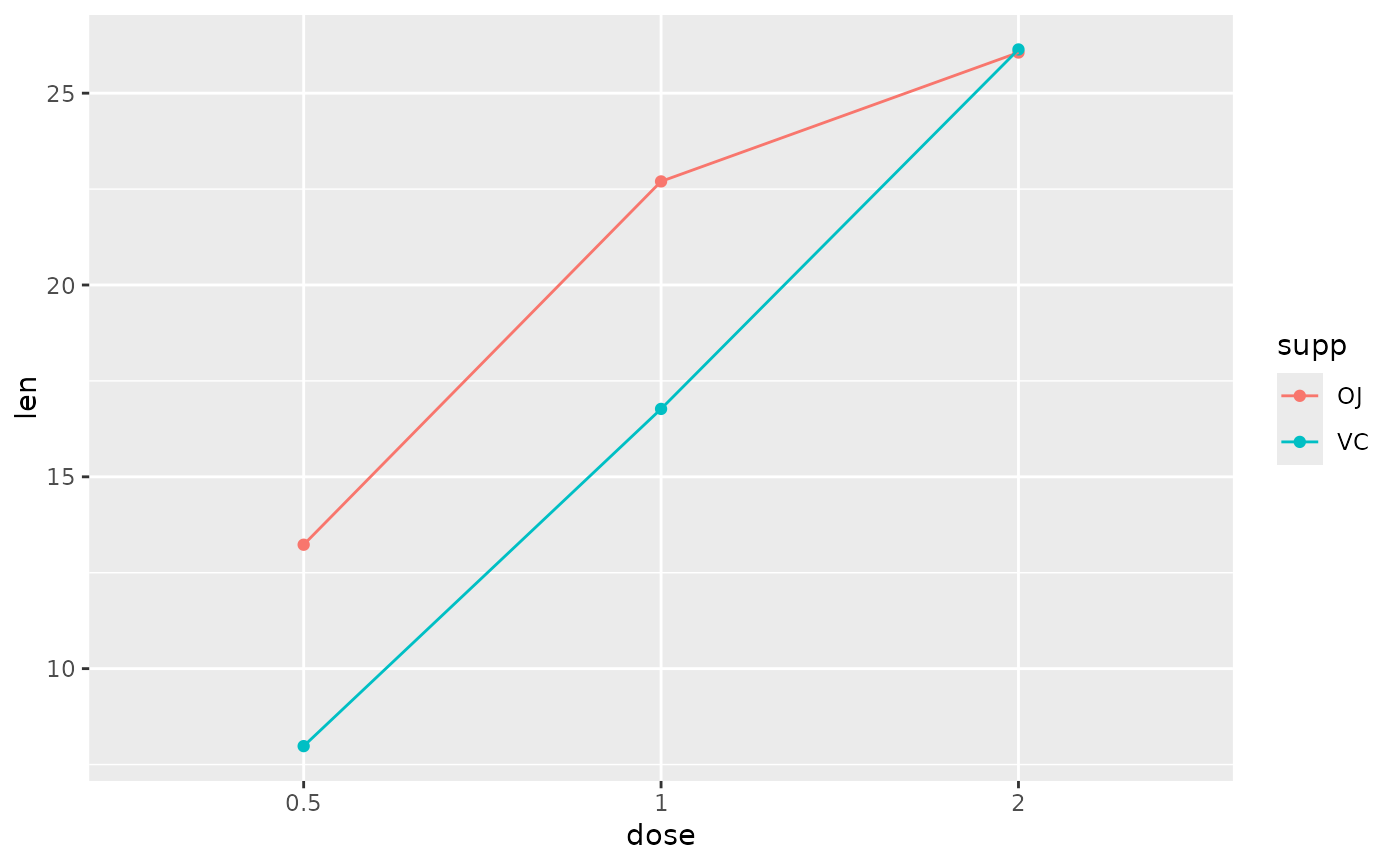
ToothGrowth |> interaction_plot(len ~ dose + supp)
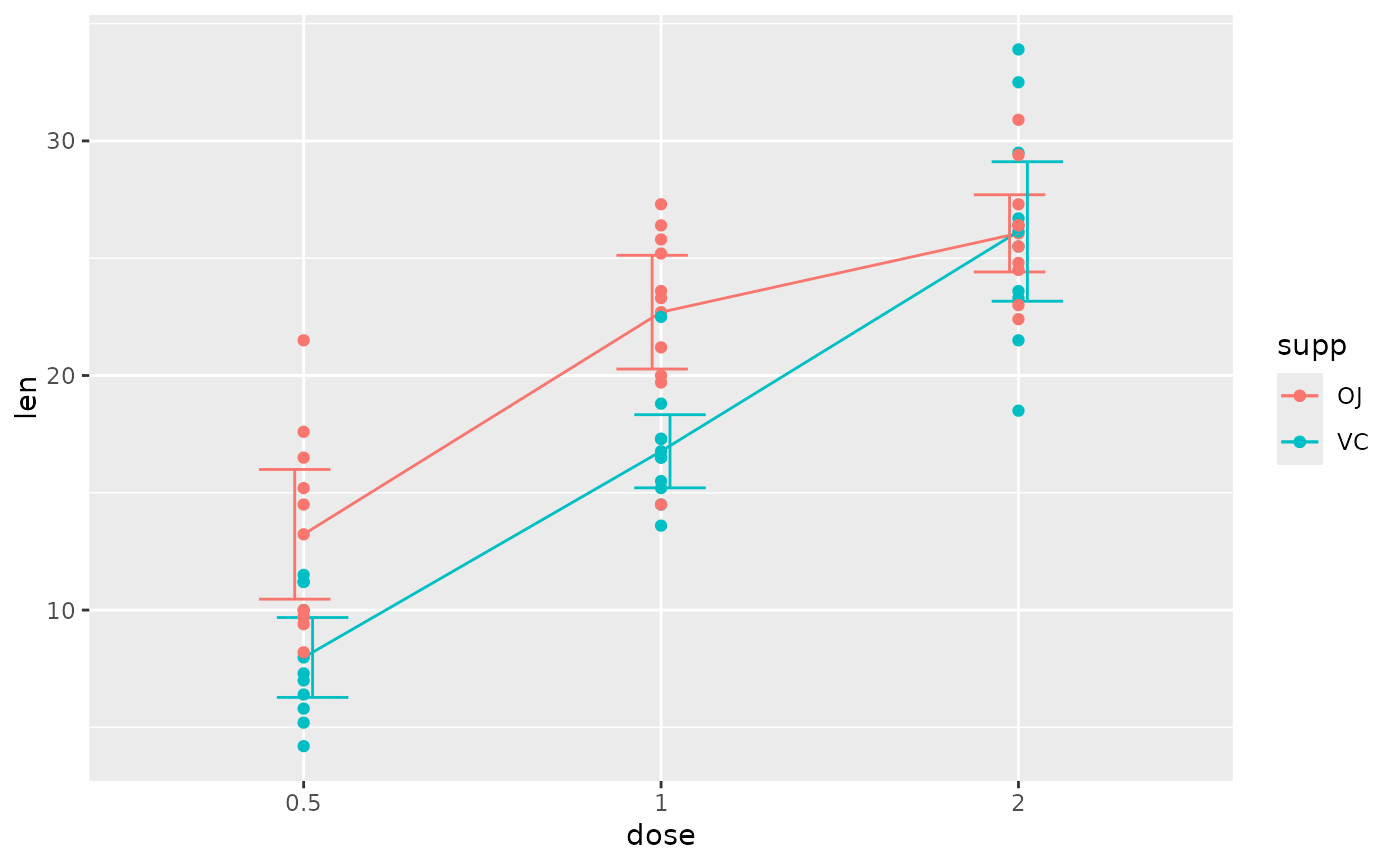
 ToothGrowth |> interaction_plot(len ~ dose + supp, interval="conf.int")
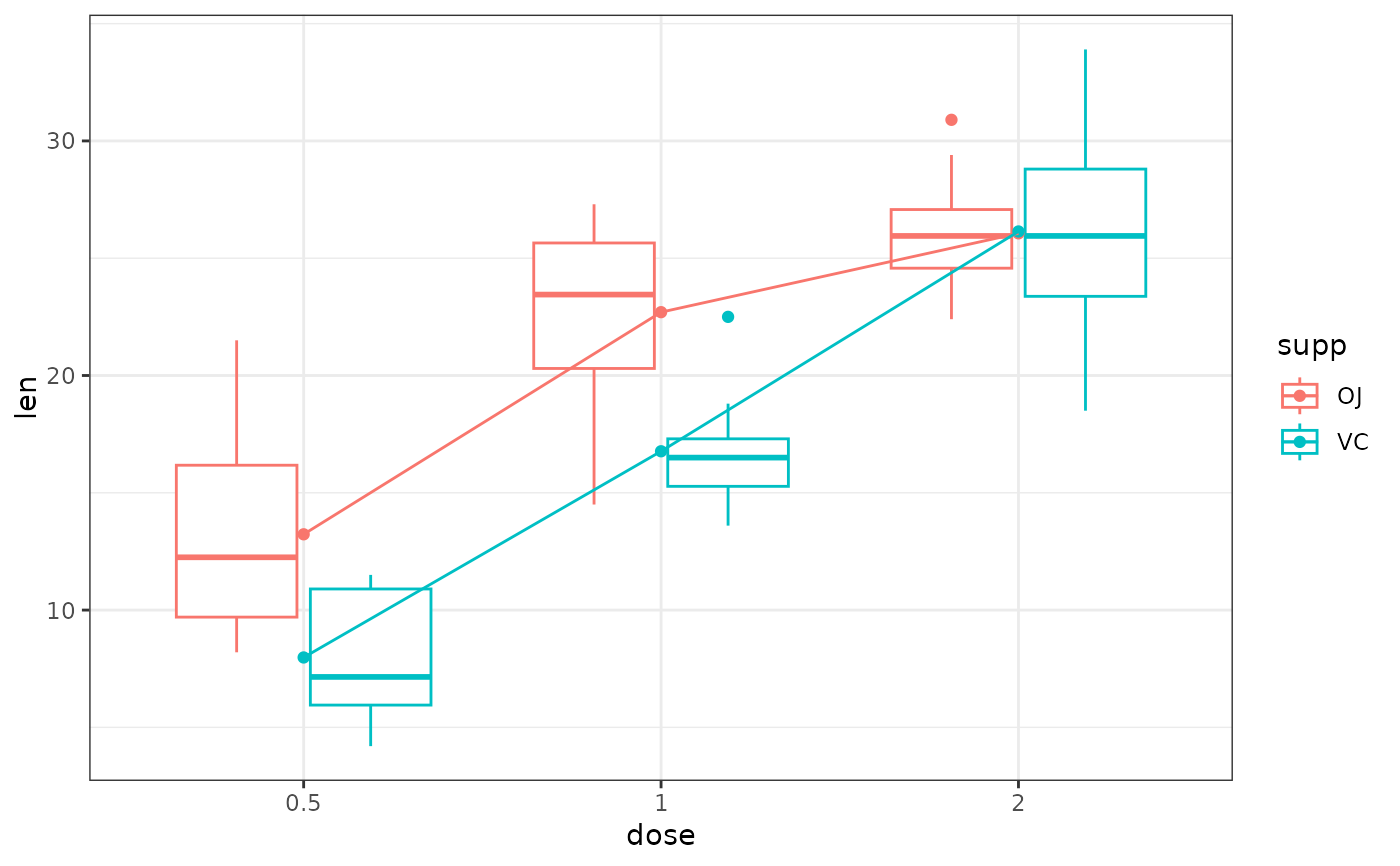
 ToothGrowth |> interaction_plot(len ~ dose + supp, interval="boxplot")
 ToothGrowth |> interaction_plot(len ~ dose + supp, interval="none")