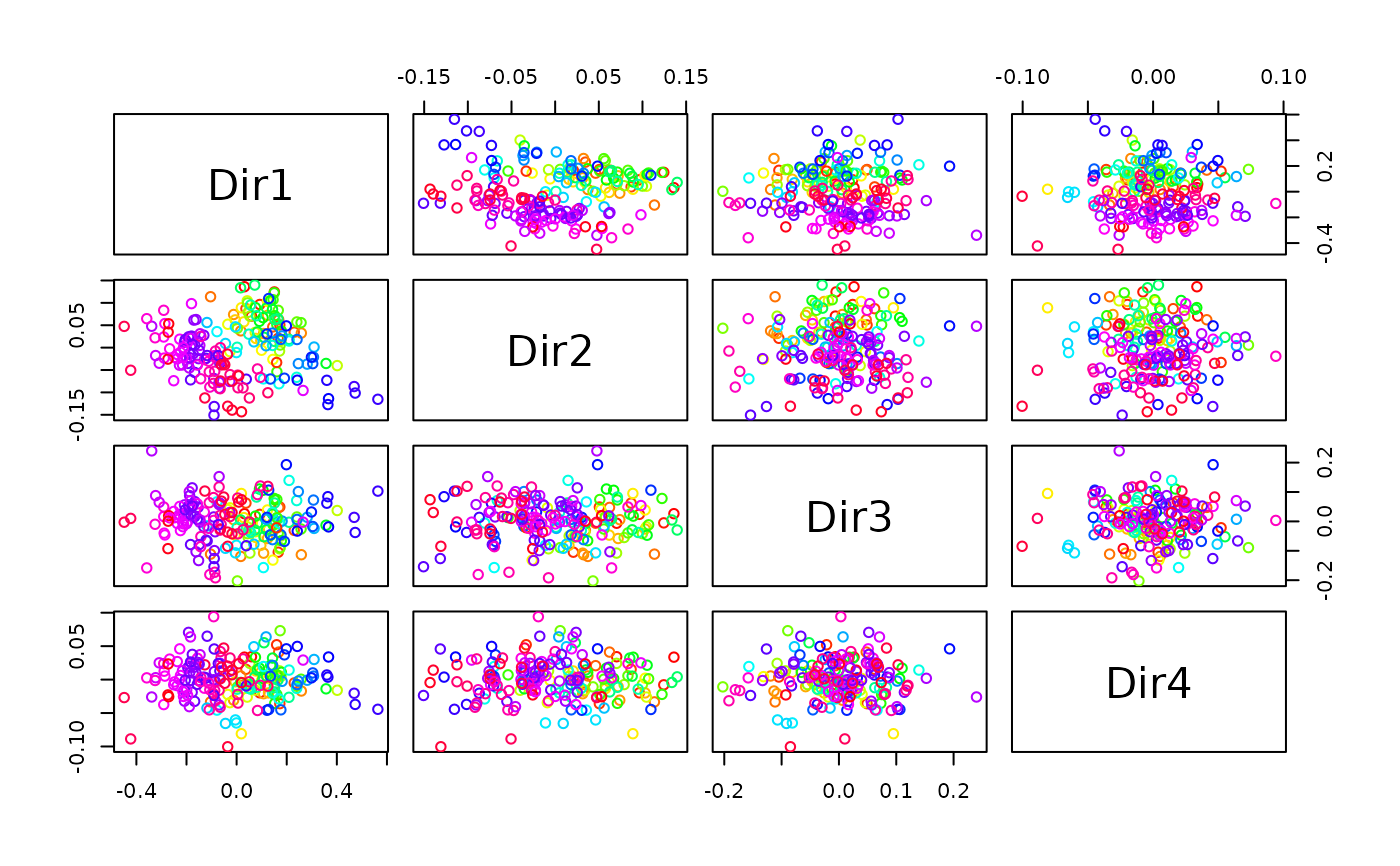
Basic plot of a dr object
plot.dr.RdPlots selected direction vectors determined by a dimension reduction regression fit.
By default, the pairs function is used for plotting, but the user can use any
other graphics command that is appropriate.
# S3 method for class 'dr'
plot(x, which = 1:x$numdir, mark.by.y = FALSE, plot.method = pairs, ...)
Arguments
- x
The name of an object of class dr, a dimension reduction regression object
- which
selects the directions to be plotted
- mark.by.y
if TRUE, color points according to the value of the response, otherwise, do not color points but include the response as a variable in the plot.
- plot.method
the name of a function for the plotting. The default is
pairs.- ...
arguments passed to the plot.method.
Value
Returns a graph.