This function extracts the fitted values from a model estimated with femlm,
feols or feglm. The fitted values that are returned are the expected predictor.
# S3 method for class 'fixest'
fitted(object, type = c("response", "link"), na.rm = TRUE, ...)

# S3 method for class 'fixest'
fitted.values(object, type = c("response", "link"), na.rm = TRUE, ...)
Arguments
- object
A
fixestobject. Obtained using the functionsfemlm,feolsorfeglm.- type
Character either equal to
"response"(default) or"link". Iftype="response", then the output is at the level of the response variable, i.e. it is the expected predictor \(E(Y|X)\). If"link", then the output is at the level of the explanatory variables, i.e. the linear predictor \(X\cdot \beta\).- na.rm
Logical, default is
TRUE. IfFALSEthe number of observation returned will be the number of observations in the original data set, otherwise it will be the number of observations used in the estimation.- ...
Not currently used.
Value
It returns a numeric vector of length the number of observations used to estimate the model.
If type = "response", the value returned is the expected predictor, i.e. the
expected value of the dependent variable for the fitted model: \(E(Y|X)\).
If type = "link", the value returned is the linear predictor of the fitted model,
that is \(X\cdot \beta\) (remind that \(E(Y|X) = f(X\cdot \beta)\)).
Details
This function returns the expected predictor of a fixest fit. The likelihood functions
are detailed in femlm help page.
See also
See also the main estimation functions femlm, feols or feglm.
resid.fixest, predict.fixest, summary.fixest, vcov.fixest, fixef.fixest.
Examples
# simple estimation on iris data, using "Species" fixed-effects
res_poisson = femlm(Sepal.Length ~ Sepal.Width + Petal.Length +
Petal.Width | Species, iris)
# we extract the fitted values
y_fitted_poisson = fitted(res_poisson)
# Same estimation but in OLS (Gaussian family)
res_gaussian = femlm(Sepal.Length ~ Sepal.Width + Petal.Length +
Petal.Width | Species, iris, family = "gaussian")
y_fitted_gaussian = fitted(res_gaussian)
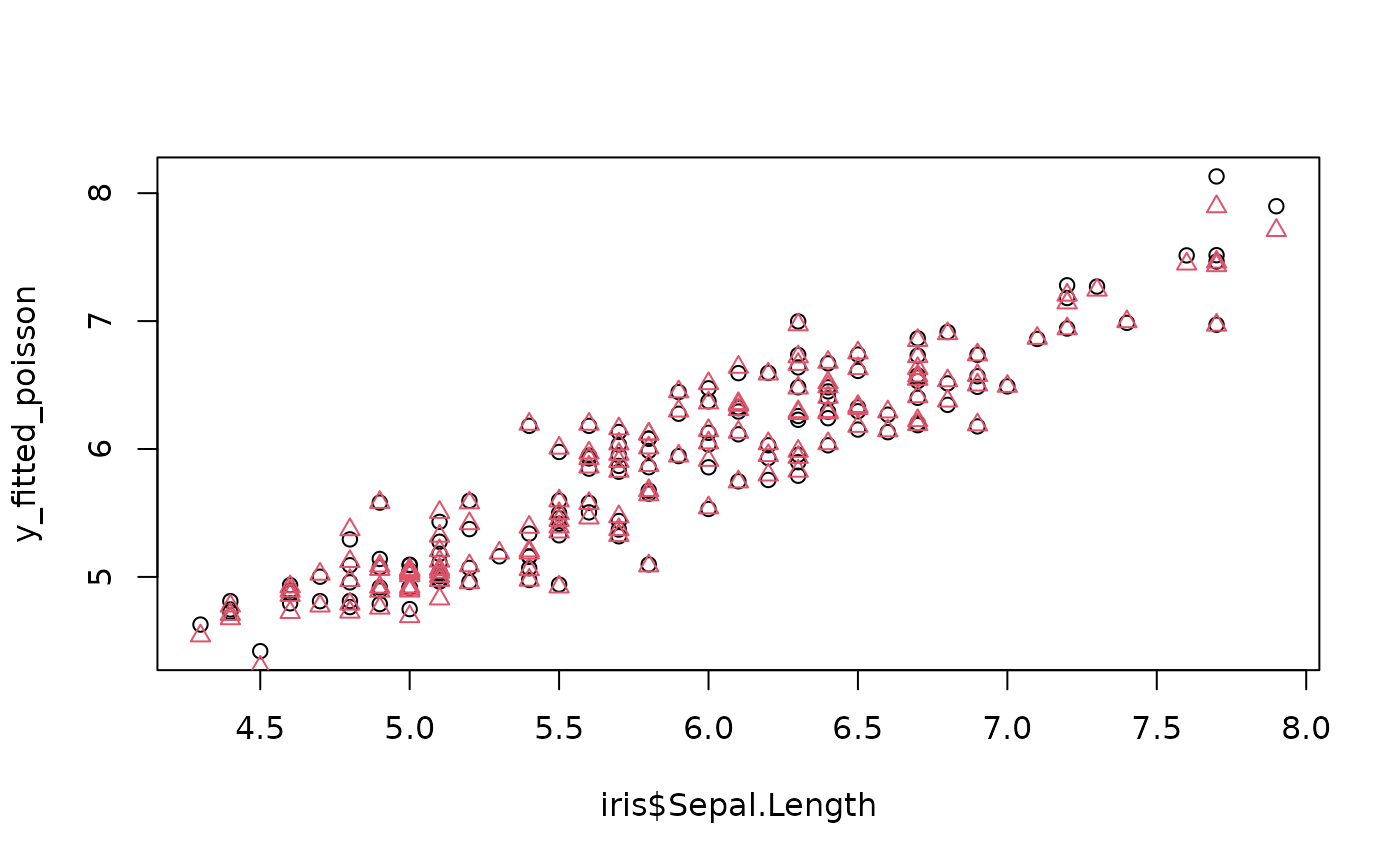
# comparison of the fit for the two families
plot(iris$Sepal.Length, y_fitted_poisson)
points(iris$Sepal.Length, y_fitted_gaussian, col = 2, pch = 2)