Remove grid lines from a ggplot2 plot, to have a cleaner and simpler plot
removeGrid(x = TRUE, y = TRUE)

removeGridX()

removeGridY()
Arguments
Value
A ggplot2 layer that can be added to an existing ggplot2 object.
Details
Minor grid lines are always removed.
removeGrid removes the major grid lines from the x and/or y axis
(both by default).
removeGridX is a shortcut for removeGrid(x = TRUE, y = FALSE)
removeGridY is a shortcut for removeGrid(x = FALSE, y = TRUE)
Examples
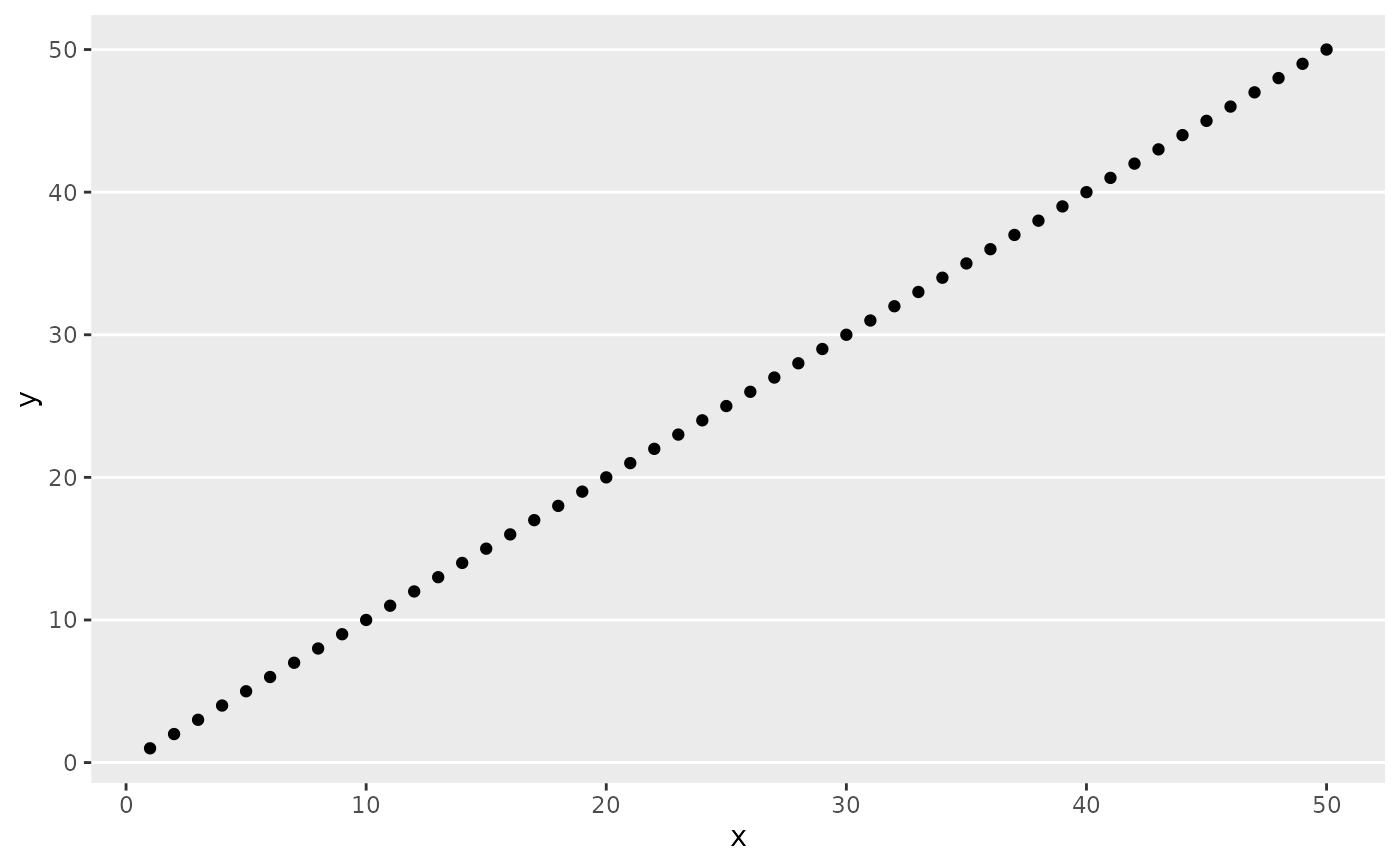
df <- data.frame(x = 1:50, y = 1:50)
p <- ggplot2::ggplot(df, ggplot2::aes(x, y)) + ggplot2::geom_point()
p + removeGrid()

p + removeGrid(y = FALSE)

p + removeGridX()