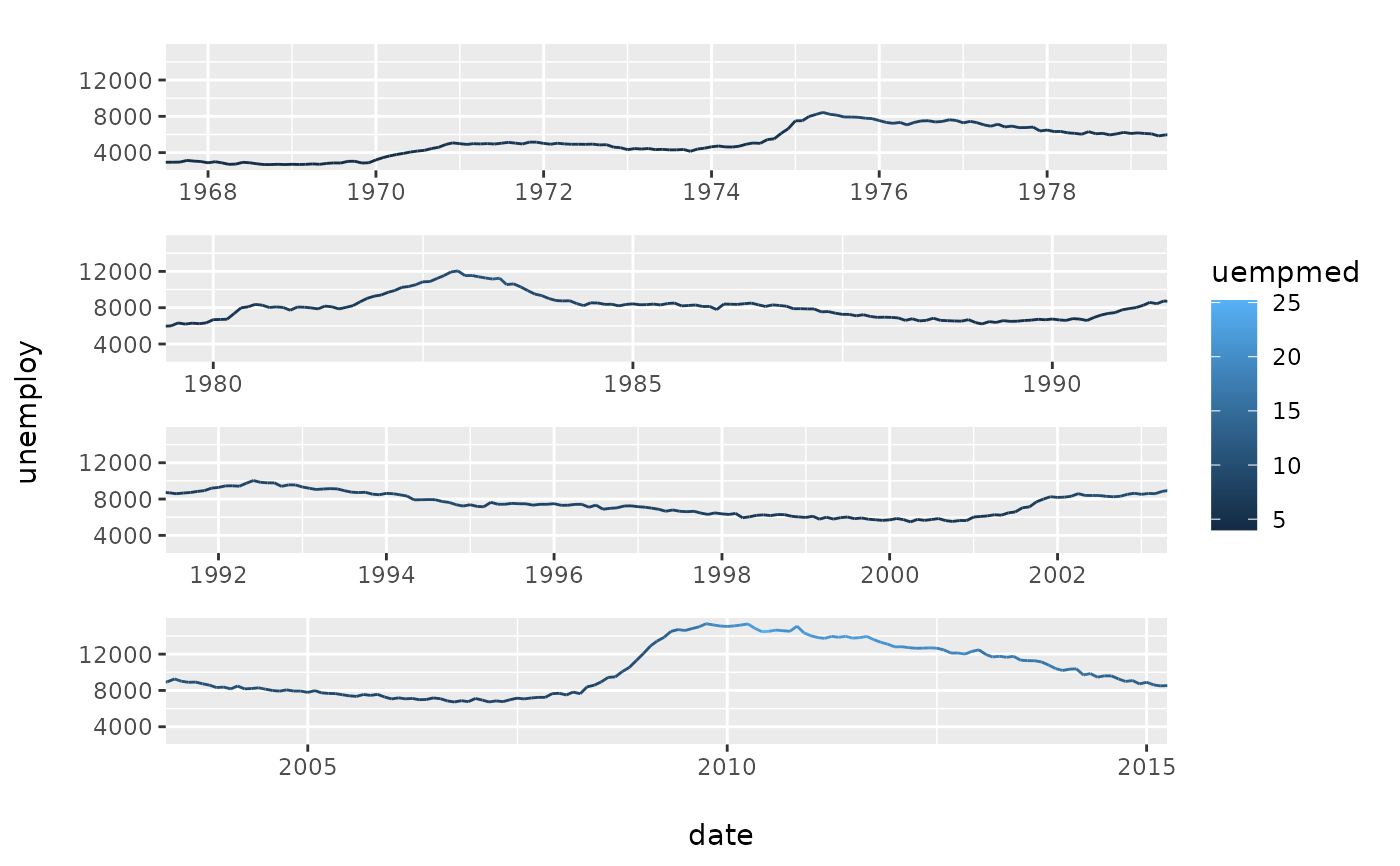
This scale function wraps a 'gg' plot over multiple rows to make plots with long x axes easier to read.
scale_wrap(n)Value
gg object
This scale function wraps a 'gg' plot over multiple rows to make plots with long x axes easier to read.
scale_wrap(n)gg object