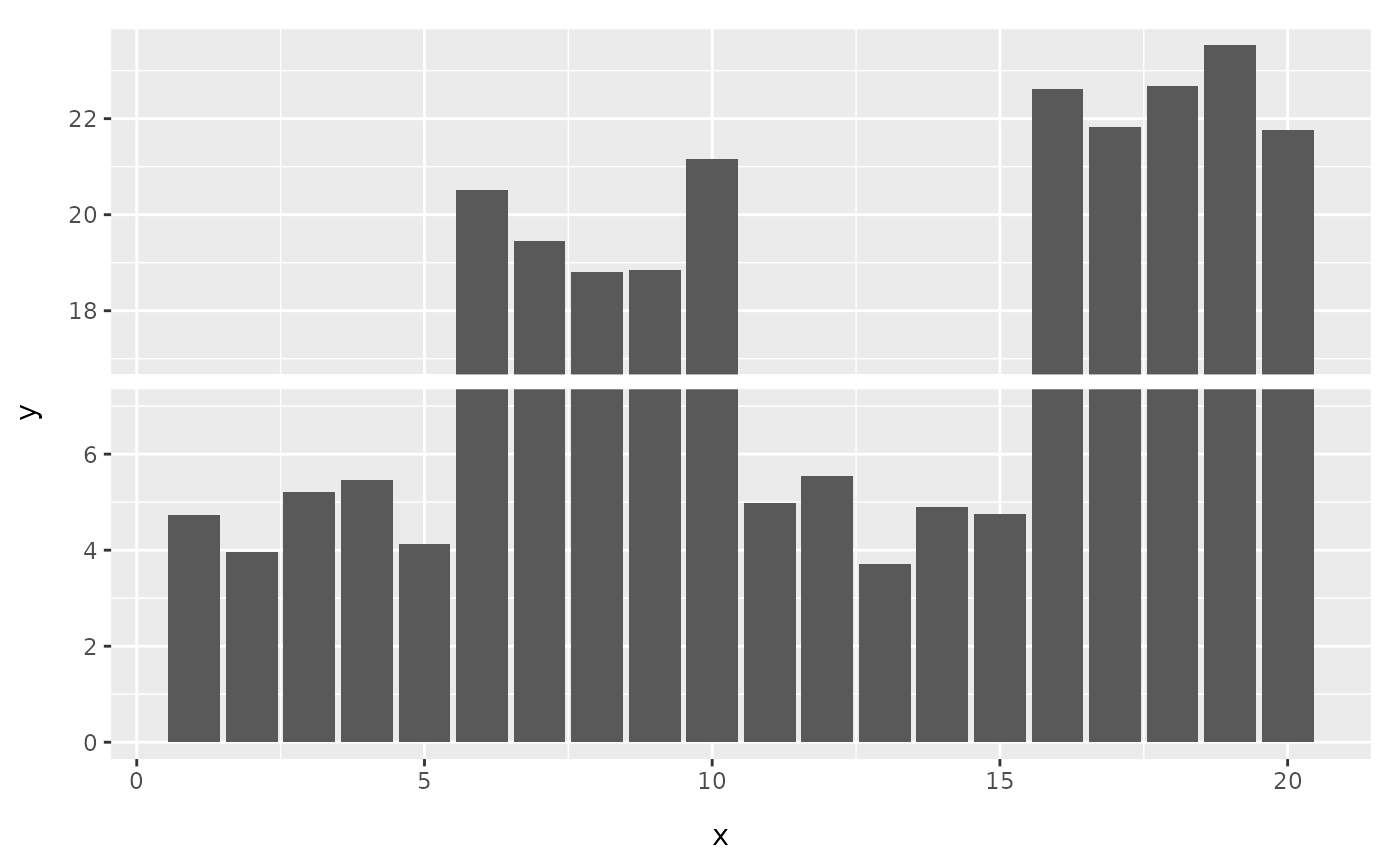
Set an axis break point for a 'gg' plot
scale_x_break(
  breaks,
  scales = "fixed",
  ticklabels = NULL,
  expand = TRUE,
  space = 0.1
)

scale_y_break(
  breaks,
  scales = "fixed",
  ticklabels = NULL,
  expand = TRUE,
  space = 0.1
)
Arguments
- breaks
break point
- scales
relative width or height of subplots, default is "fixed". If scale is 'free', all subplots have equal width or height. It also can be any number to set relative width or height compare to first subplot.
- ticklabels
the axis labels to subplot, default is NULL.
- expand
default is TRUE, logical or a vector of range expansion constants used to add some padding around the data to ensure that they are placed some distance away from the axes. Use the convenience function
expansion()ofggplot2to generate the values for theexpandargument. The defaults are to expand the scale by 5% on each side for continuous variables. If it is logical, theTRUEmeans the default ofggplot2(foregoing statement), andFALSEmeans no expand for the plot.- space
the blank space among the subplots after break, default is 0.1 (cm).
Value
gg object
Details
This scale function set an axis break point for a 'gg' plot. Either 'x' and 'y' axes are supported. The result is still a 'gg' object and user can progressively add layers to it.