![[Deprecated]](figures/lifecycle-deprecated.svg) Discrete position scales containing interacting factors can be visualised
more clearly with a nested axis guide. Nested axis guides separate labels
based on a delimiter and groups identical later labels, indicating the
grouping with a line spanning the earlier labels.
The function is deprecated due to superior alternatives such as
Discrete position scales containing interacting factors can be visualised
more clearly with a nested axis guide. Nested axis guides separate labels
based on a delimiter and groups identical later labels, indicating the
grouping with a line spanning the earlier labels.
The function is deprecated due to superior alternatives such as
legendry::guide_axis_nested().
Arguments
- title
A character string or expression indicating a title of guide. If
NULL, the title is not shown. By default (waiver()), the name of the scale object or the name specified inlabs()is used for the title.- check.overlap
silently remove overlapping labels, (recursively) prioritizing the first, last, and middle labels.
- angle
Compared to setting the angle in
theme()/element_text(), this also uses some heuristics to automatically pick thehjustandvjustthat you probably want. Can be one of the following:NULLto take the angles andhjust/vjustdirectly from the theme.waiver()to allow reasonable defaults in special cases.A number representing the text angle in degrees.
- n.dodge
The number of rows (for vertical axes) or columns (for horizontal axes) that should be used to render the labels. This is useful for displaying labels that would otherwise overlap.
- order
A positive
integerof length 1 that specifies the order of this guide among multiple guides. This controls in which order guides are merged if there are multiple guides for the same position. If 0 (default), the order is determined by a secret algorithm.- position
Where this guide should be drawn: one of top, bottom, left, or right.
- delim
A
characterof length 1 to tellstrsplithow hierarchies should be broken up. Internally defaults to"."to matchinteraction's default delimiter.- inv
A
logical(1)which ifTRUE, flips the grouping order. IfFALSE(default), the grouping order is as-is.- trunc_lower, trunc_upper
The lower and upper range of the truncated axis:
NULLto not perform any truncation.A
functionthat takes the break positions as input and returns the lower or upper boundary. Note that also for discrete scales, positions are the mapped positions asnumeric.A
numericvalue in data units for the lower and upper boundaries.A
unitobject.
- colour, color
A
character(1)with a valid colour for colouring the axis text, axis ticks and axis line. Overrules the colour assigned by the theme.- extend
A
numericof length 1 indicating how much to extend nesting lines relative to the smallest difference in break positions.
Value
A axis_nested guide class object.
Details
The guide itself makes no effort to group and order labels. To get nice groupings, consider re-ordering the levels of factor variables, or try setting the 'breaks' argument of a scale appropriately.
Theme elements
This axis guide uses the following the theme elements:
ggh4x.axis.nestline.x/yAn
element_line()object to alter the display of the line separating different layers of labels.ggh4x.axis.nesttext.x/yAn
element_text()object to differentiate text higher up in the hierarchy, from the text closest to the axis line.
See also
ggplot2::guide_axis() for the classic axis
documentation. weave_factors() for an alternative to
interaction().
Other axis-guides:
guide_axis_logticks(),
guide_axis_manual(),
guide_axis_minor(),
guide_axis_scalebar(),
guide_axis_truncated()
Examples
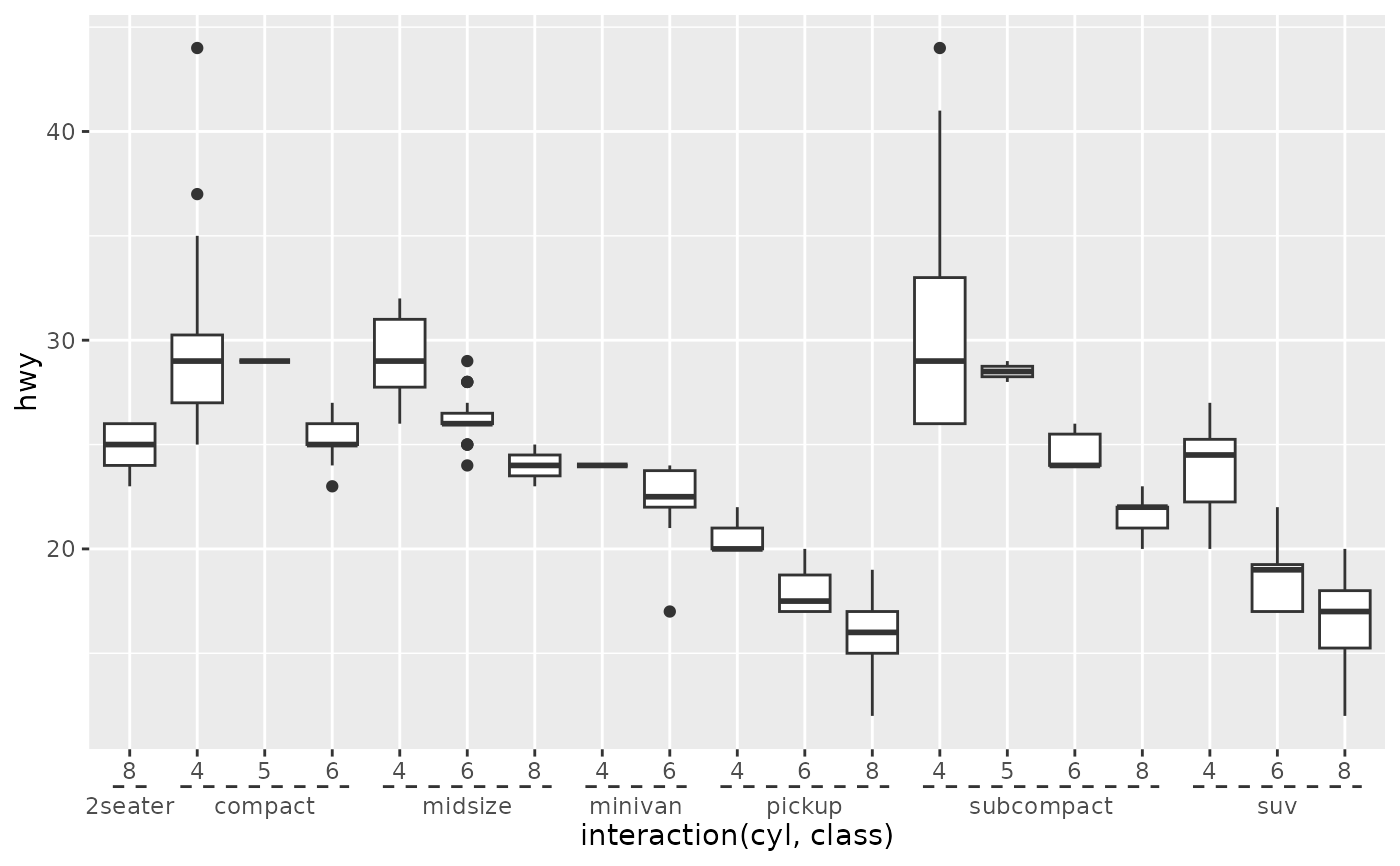
# The defaults are suited for interaction variables
ggplot(mpg, aes(interaction(cyl, class), hwy)) +
geom_boxplot() +
scale_x_discrete(guide = "axis_nested")
#> Warning: `guide_axis_nested()` was deprecated in ggh4x 0.3.0.
#> ℹ Please use `legendry::guide_axis_nested()` instead.
#> ℹ The deprecated feature was likely used in the ggplot2 package.
#> Please report the issue at <https://github.com/tidyverse/ggplot2/issues>.
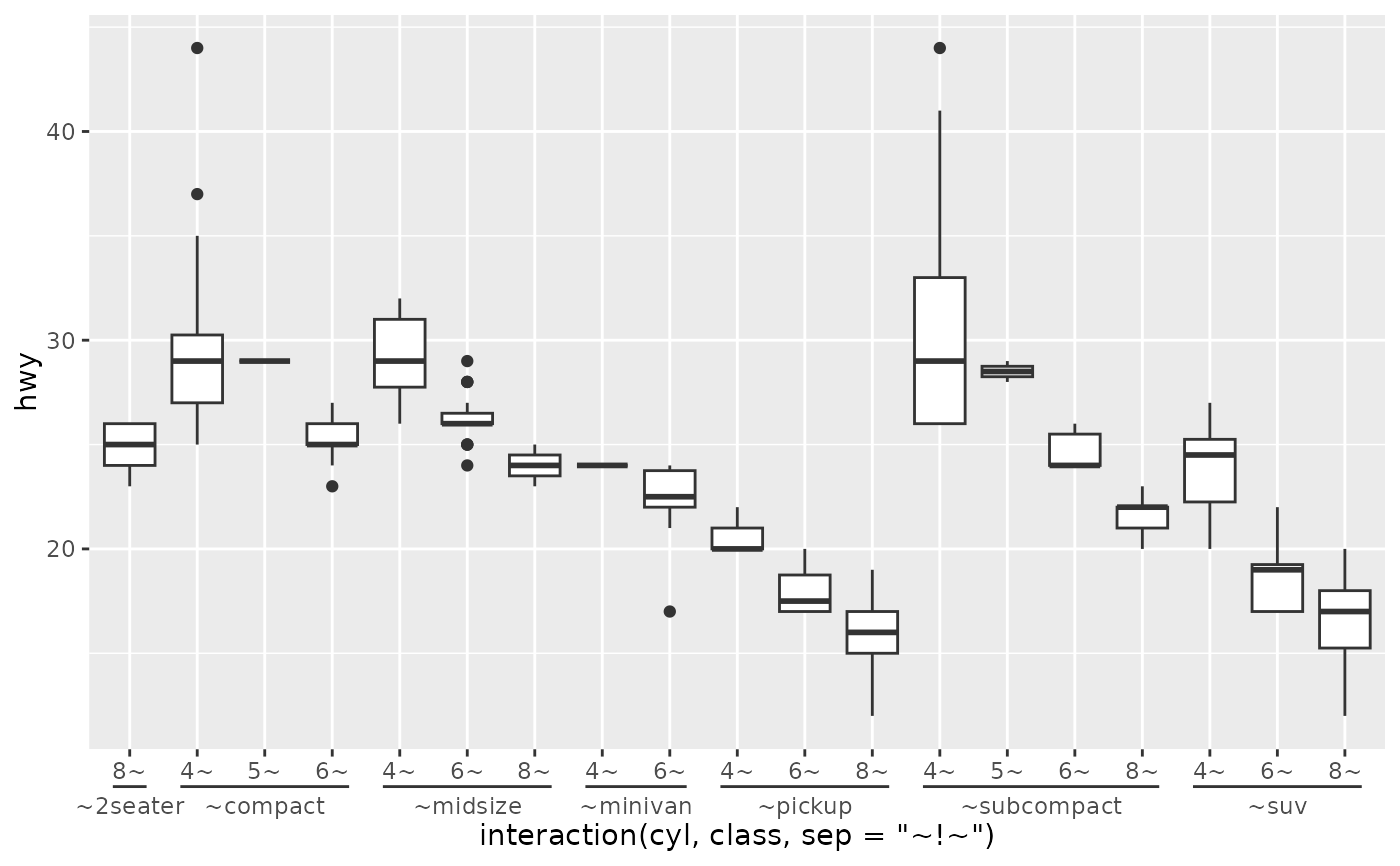
 # Control where labels are cut with the delim argument
ggplot(mpg, aes(interaction(cyl, class, sep = "~!~"), hwy)) +
geom_boxplot() +
scale_x_discrete(guide = guide_axis_nested(delim = "!"))
# Control where labels are cut with the delim argument
ggplot(mpg, aes(interaction(cyl, class, sep = "~!~"), hwy)) +
geom_boxplot() +
scale_x_discrete(guide = guide_axis_nested(delim = "!"))
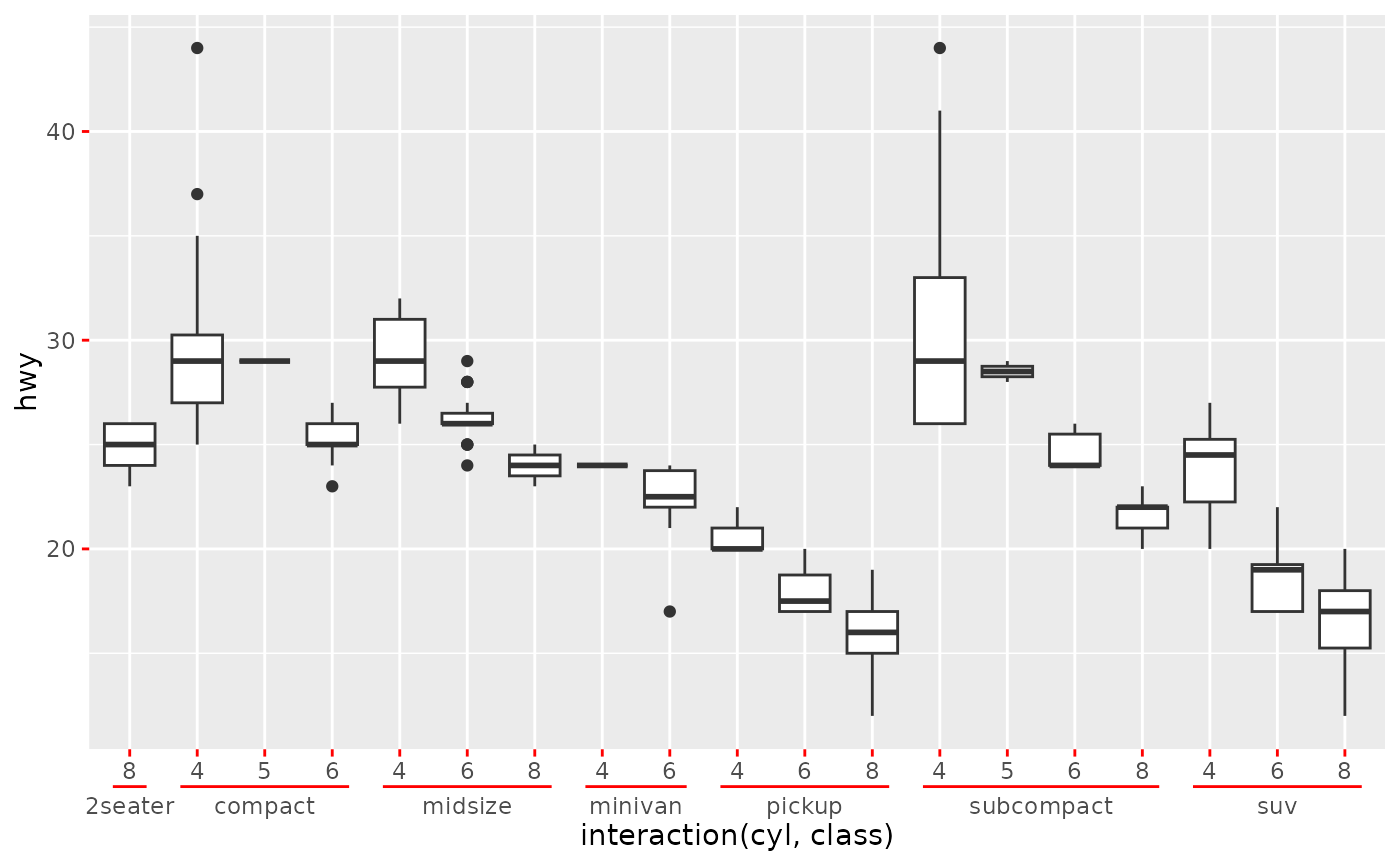
 # The nesting lines inherit looks from axis ticks
ggplot(mpg, aes(interaction(cyl, class), hwy)) +
geom_boxplot() +
scale_x_discrete(guide = "axis_nested") +
theme(axis.ticks = element_line(colour = "red"))
# The nesting lines inherit looks from axis ticks
ggplot(mpg, aes(interaction(cyl, class), hwy)) +
geom_boxplot() +
scale_x_discrete(guide = "axis_nested") +
theme(axis.ticks = element_line(colour = "red"))
 # The looks can be controlled independently by setting `ggh4x.axis.nestline`
ggplot(mpg, aes(interaction(cyl, class), hwy)) +
geom_boxplot() +
scale_x_discrete(guide = "axis_nested") +
theme(ggh4x.axis.nestline = element_line(linetype = 2))
# The looks can be controlled independently by setting `ggh4x.axis.nestline`
ggplot(mpg, aes(interaction(cyl, class), hwy)) +
geom_boxplot() +
scale_x_discrete(guide = "axis_nested") +
theme(ggh4x.axis.nestline = element_line(linetype = 2))