Default line types based on a set supplied by Richard Pearson,
University of Manchester. Continuous values can not be mapped to
line types unless scale_linetype_binned() is used. Still, as linetypes has
no inherent order, this use is not advised.
Arguments
- name
The name of the scale. Used as the axis or legend title. If
waiver(), the default, the name of the scale is taken from the first mapping used for that aesthetic. IfNULL, the legend title will be omitted.- ...
Arguments passed on to
discrete_scalepaletteA palette function that when called with a single integer argument (the number of levels in the scale) returns the values that they should take (e.g.,
scales::pal_hue()).breaksOne of:
limitsOne of:
NULLto use the default scale valuesA character vector that defines possible values of the scale and their order
A function that accepts the existing (automatic) values and returns new ones. Also accepts rlang lambda function notation.
dropShould unused factor levels be omitted from the scale? The default,
TRUE, uses the levels that appear in the data;FALSEincludes the levels in the factor. Please note that to display every level in a legend, the layer should useshow.legend = TRUE.na.translateUnlike continuous scales, discrete scales can easily show missing values, and do so by default. If you want to remove missing values from a discrete scale, specify
na.translate = FALSE.aestheticsThe names of the aesthetics that this scale works with.
labelsOne of:
NULLfor no labelswaiver()for the default labels computed by the transformation objectA character vector giving labels (must be same length as
breaks)An expression vector (must be the same length as breaks). See ?plotmath for details.
A function that takes the breaks as input and returns labels as output. Also accepts rlang lambda function notation.
guideA function used to create a guide or its name. See
guides()for more information.callThe
callused to construct the scale for reporting messages.superThe super class to use for the constructed scale
- na.value
The linetype to use for
NAvalues.
See also
The documentation for differentiation related aesthetics.
Other linetype scales: scale_linetype_manual(), scale_linetype_identity().
The line type section of the online ggplot2 book.
Examples
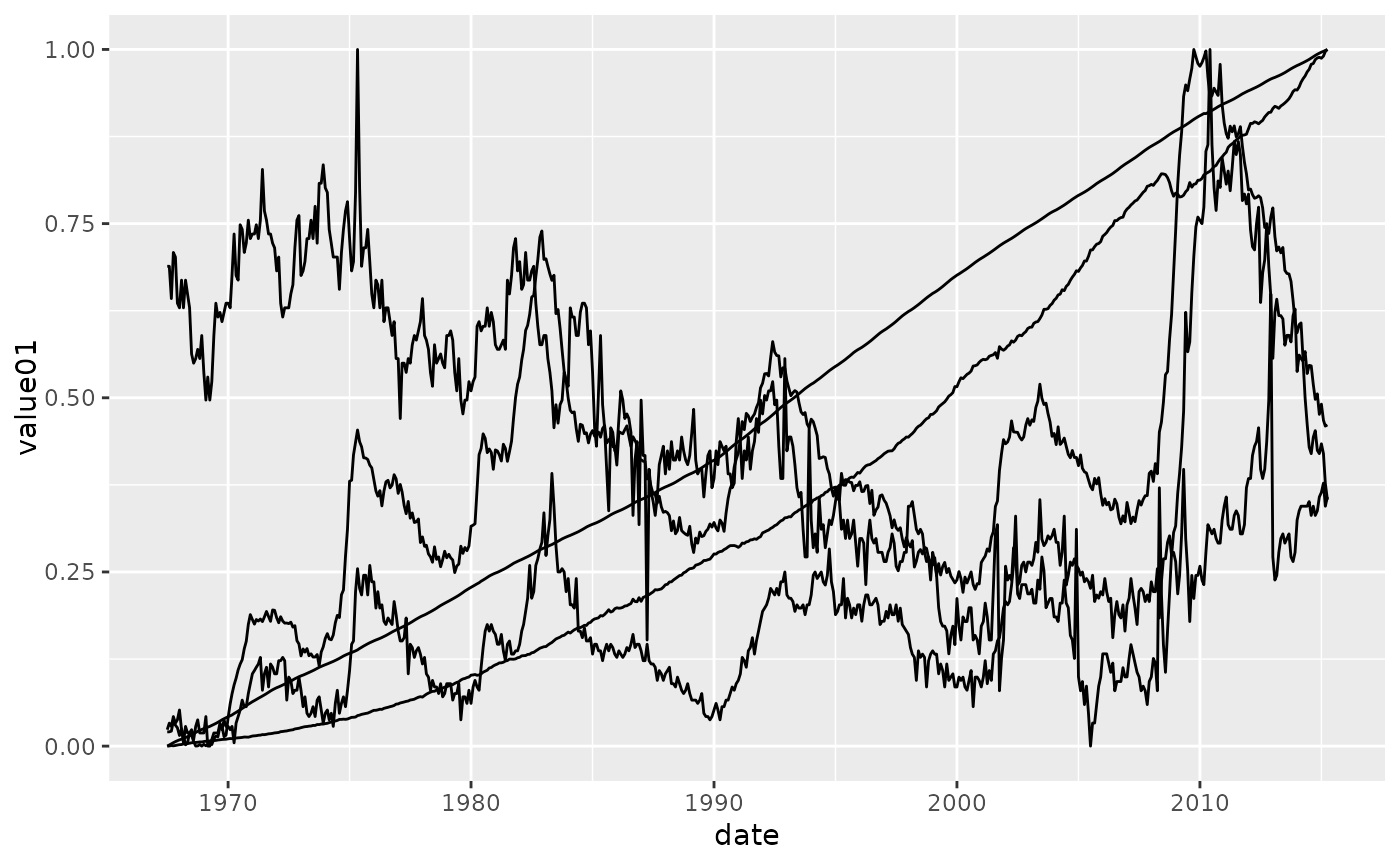
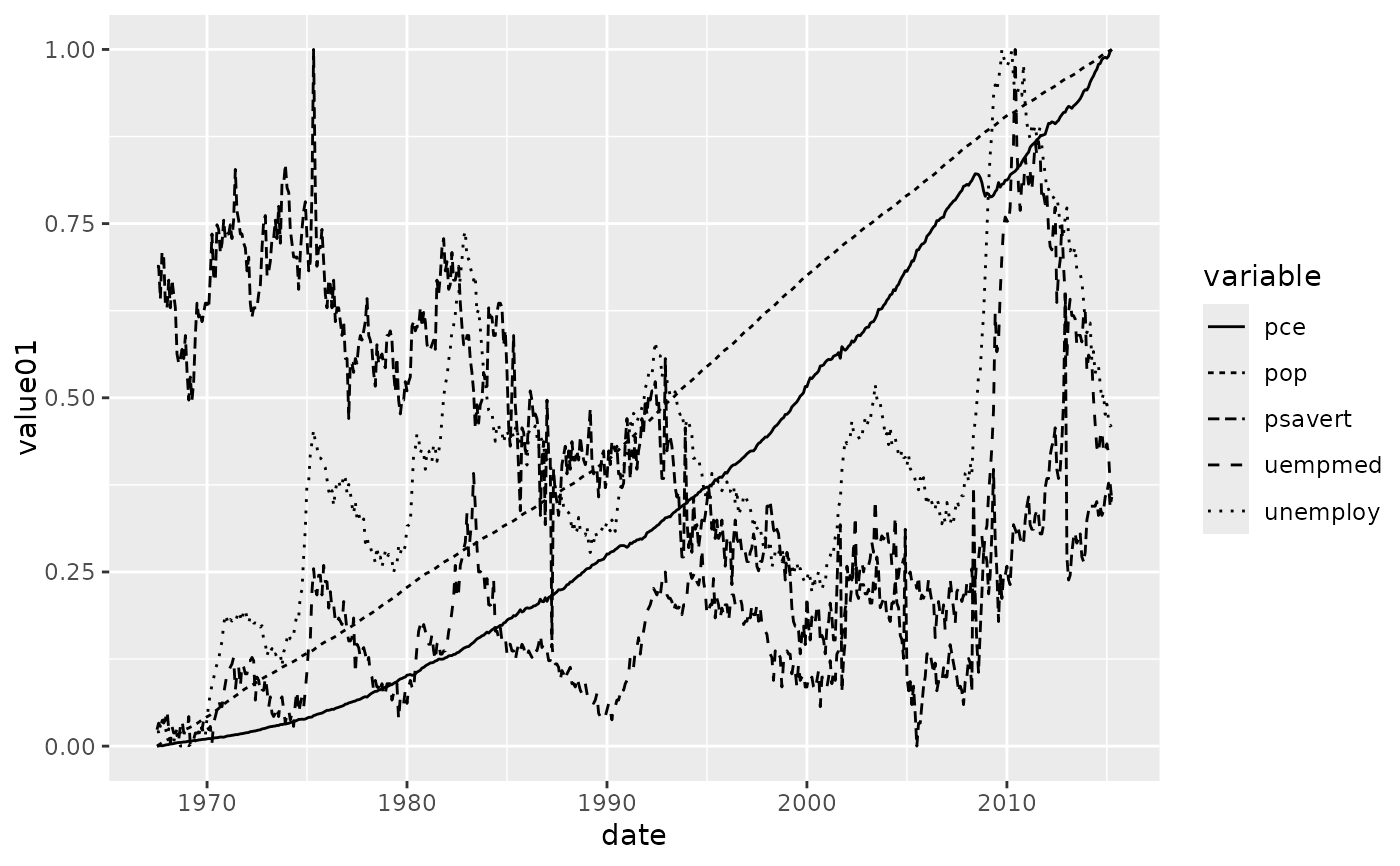
base <- ggplot(economics_long, aes(date, value01))
base + geom_line(aes(group = variable))

base + geom_line(aes(linetype = variable))


# See scale_manual for more flexibility

# Common line types ----------------------------
df_lines <- data.frame(
  linetype = factor(
    1:4,
    labels = c("solid", "longdash", "dashed", "dotted")
  )
)
ggplot(df_lines) +
  geom_hline(aes(linetype = linetype, yintercept = 0), linewidth = 2) +
  scale_linetype_identity() +
  facet_grid(linetype ~ .) +
  theme_void(20)
# See scale_manual for more flexibility
# Common line types ----------------------------
df_lines <- data.frame(
linetype = factor(
1:4,
labels = c("solid", "longdash", "dashed", "dotted")
)
)
ggplot(df_lines) +
geom_hline(aes(linetype = linetype, yintercept = 0), linewidth = 2) +
scale_linetype_identity() +
facet_grid(linetype ~ .) +
theme_void(20)
