In conjunction with the theme system, the element_ functions
specify the display of how non-data components of the plot are drawn.
element_blank(): draws nothing, and assigns no space.element_rect(): borders and backgrounds.element_line(): lines.element_text(): text.element_polygon(): polygons.element_point(): points.element_geom(): defaults for drawing layers.
rel() is used to specify sizes relative to the parent,
margin(), margin_part() and margin_auto() are all used to specify the
margins of elements.
margin(t = 0, r = 0, b = 0, l = 0, unit = "pt", ...)

margin_part(t = NA, r = NA, b = NA, l = NA, unit = "pt")

margin_auto(t = 0, r = t, b = t, l = r, unit = "pt")

element()

element_blank()

element_rect(
  fill = NULL,
  colour = NULL,
  linewidth = NULL,
  linetype = NULL,
  color = NULL,
  linejoin = NULL,
  inherit.blank = FALSE,
  size = deprecated(),
  ...
)

element_line(
  colour = NULL,
  linewidth = NULL,
  linetype = NULL,
  lineend = NULL,
  color = NULL,
  linejoin = NULL,
  arrow = NULL,
  arrow.fill = NULL,
  inherit.blank = FALSE,
  size = deprecated(),
  ...
)

element_text(
  family = NULL,
  face = NULL,
  colour = NULL,
  size = NULL,
  hjust = NULL,
  vjust = NULL,
  angle = NULL,
  lineheight = NULL,
  color = NULL,
  margin = NULL,
  debug = NULL,
  inherit.blank = FALSE,
  ...
)

element_polygon(
  fill = NULL,
  colour = NULL,
  linewidth = NULL,
  linetype = NULL,
  color = NULL,
  linejoin = NULL,
  inherit.blank = FALSE,
  ...
)

element_point(
  colour = NULL,
  shape = NULL,
  size = NULL,
  fill = NULL,
  stroke = NULL,
  color = NULL,
  inherit.blank = FALSE,
  ...
)

element_geom(
  ink = NULL,
  paper = NULL,
  accent = NULL,
  linewidth = NULL,
  borderwidth = NULL,
  linetype = NULL,
  bordertype = NULL,
  family = NULL,
  fontsize = NULL,
  pointsize = NULL,
  pointshape = NULL,
  colour = NULL,
  color = NULL,
  fill = NULL,
  ...
)

rel(x)
Arguments
- t, r, b, l
Dimensions of each margin. (To remember order, think trouble).
- unit
Default units of dimensions. Defaults to "pt" so it can be most easily scaled with the text.
- ...
Reserved for future expansion.
- fill
Fill colour.
fill_alpha()can be used to set the transparency of the fill.- colour, color
Line/border colour. Color is an alias for colour.
alpha()can be used to set the transparency of the colour.- linewidth, borderwidth, stroke
Line/border size in mm.
- linetype, bordertype
Line type for lines and borders respectively. An integer (0:8), a name (blank, solid, dashed, dotted, dotdash, longdash, twodash), or a string with an even number (up to eight) of hexadecimal digits which give the lengths in consecutive positions in the string.
- linejoin
Line join style, one of
"round","mitre"or"bevel".- inherit.blank
Should this element inherit the existence of an
element_blankamong its parents? IfTRUEthe existence of a blank element among its parents will cause this element to be blank as well. IfFALSEany blank parent element will be ignored when calculating final element state.- size, fontsize, pointsize
text size in pts, point size in mm.
- lineend
Line end style, one of
"round","butt"or"square".- arrow
Arrow specification, as created by
grid::arrow()- arrow.fill
Fill colour for arrows.
- family
The typeface to use. The validity of this value will depend on the graphics device being used for rendering the plot. See the systemfonts vignette for guidance on the best way to access fonts installed on your computer. The values
"sans","serif", and"mono"should always be valid and will select the default typeface for the respective styles. However, what is considered default is dependant on the graphics device and the operating system.- face
Font face ("plain", "italic", "bold", "bold.italic")
- hjust
Horizontal justification (in \([0, 1]\))
- vjust
Vertical justification (in \([0, 1]\))
- angle
Angle (in \([0, 360]\))
- lineheight
Line height
- margin
Margins around the text. See
margin()for more details. When creating a theme, the margins should be placed on the side of the text facing towards the center of the plot.- debug
If
TRUE, aids visual debugging by drawing a solid rectangle behind the complete text area, and a point where each label is anchored.- shape, pointshape
Shape for points (1-25).
- ink
Foreground colour.
- paper
Background colour.
- accent
Accent colour.
- x
A single number specifying size relative to parent element.
Value
An object of class element, rel, or margin.
Details
The element_polygon() and element_point() functions are not rendered
in standard plots and just serve as extension points.
Examples
# A standard plot
plot <- ggplot(mpg, aes(displ, hwy)) + geom_point()
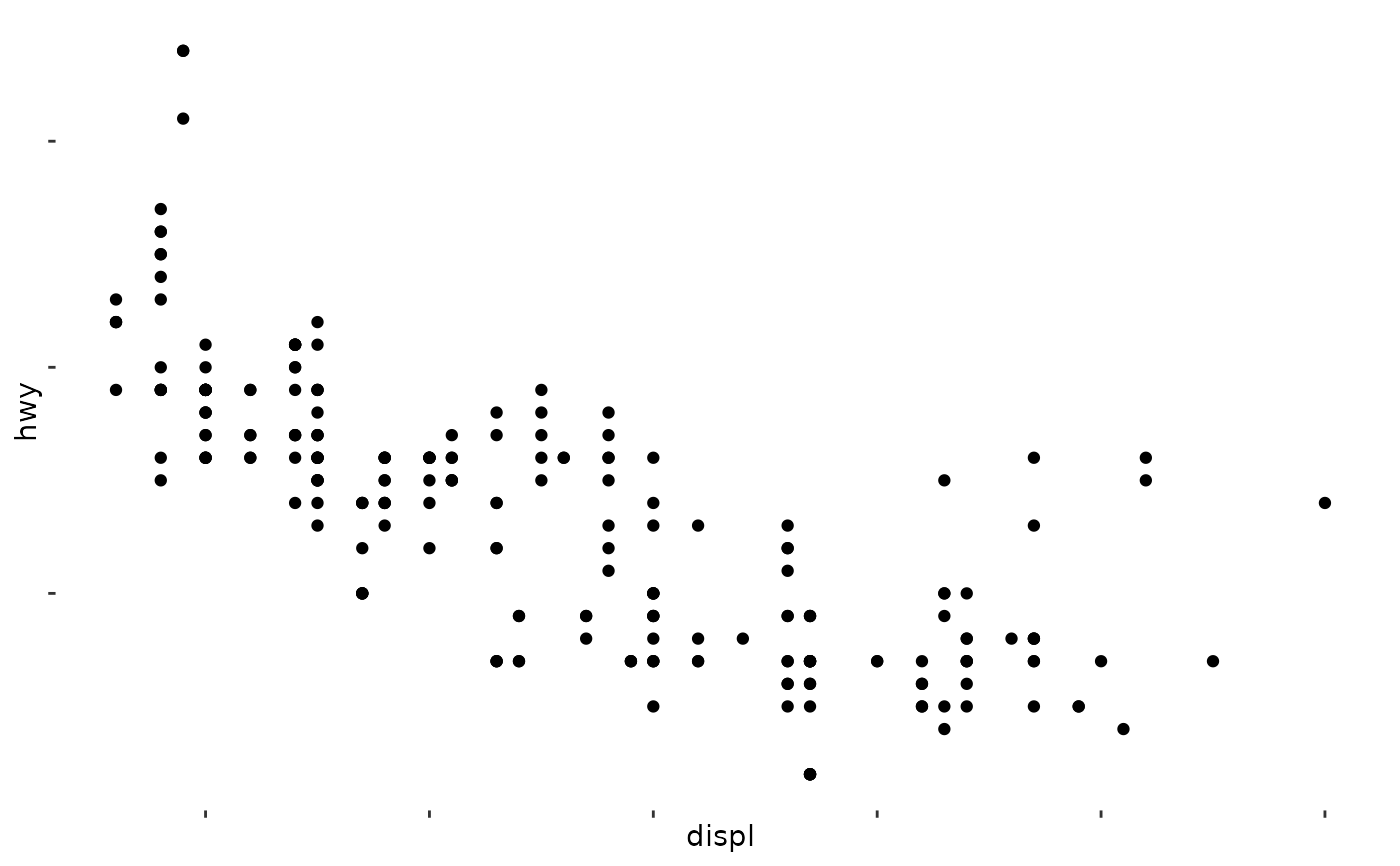
# Turning off theme elements by setting them to blank
plot + theme(
panel.background = element_blank(),
axis.text = element_blank()
)
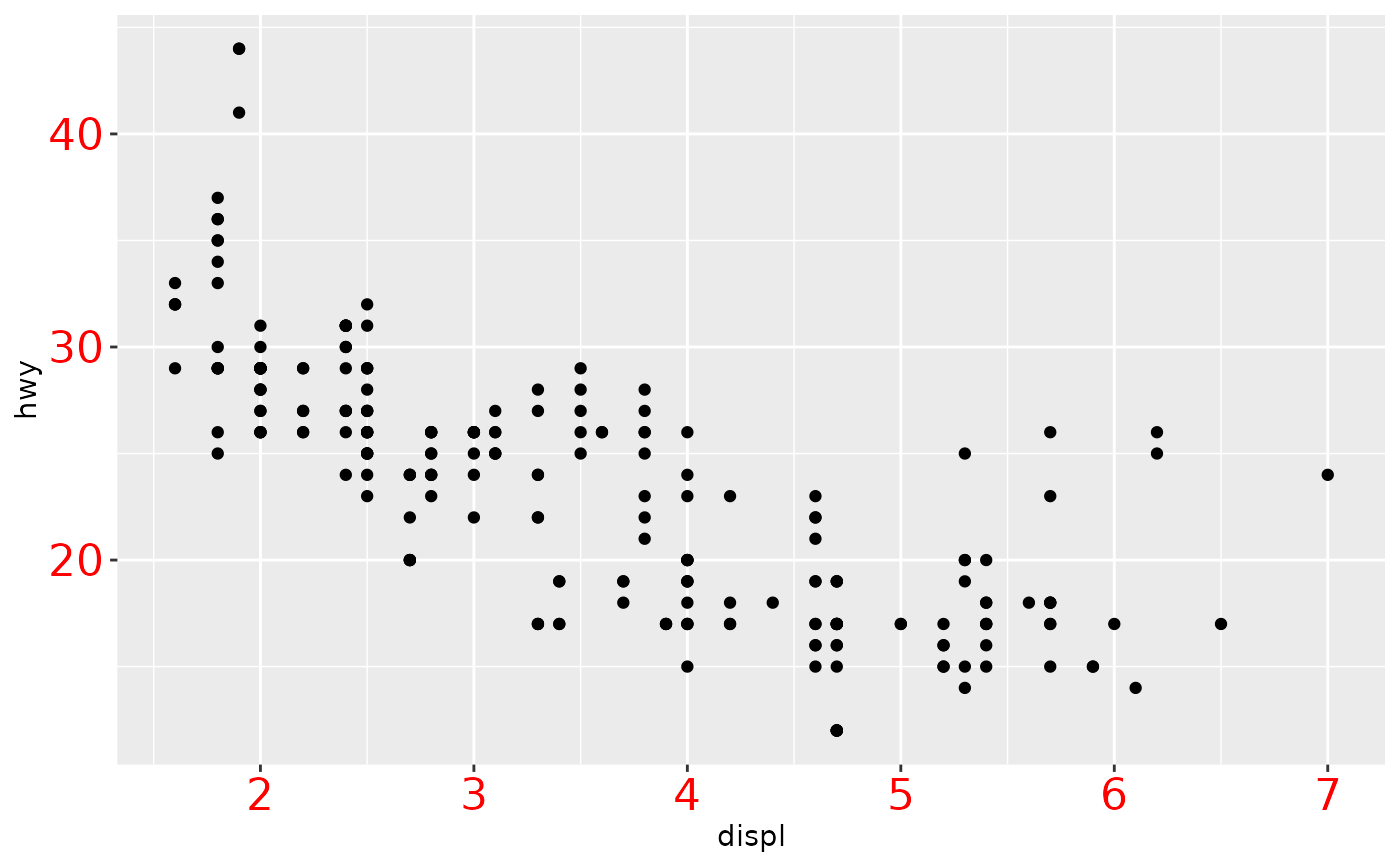
 # Text adjustments
plot + theme(
axis.text = element_text(colour = "red", size = rel(1.5))
)
# Text adjustments
plot + theme(
axis.text = element_text(colour = "red", size = rel(1.5))
)
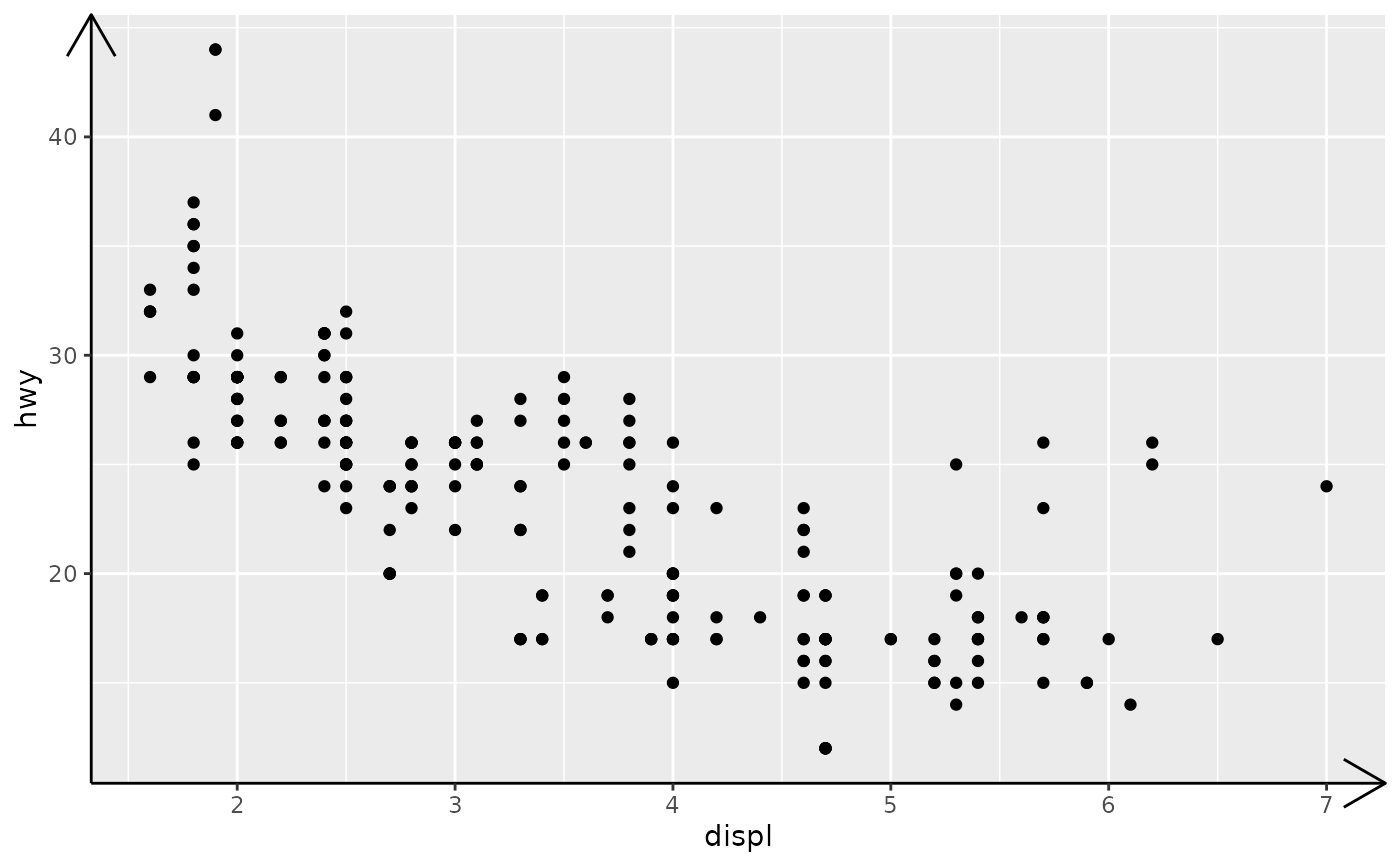
 # Turning on the axis line with an arrow
plot + theme(
axis.line = element_line(arrow = arrow())
)
# Turning on the axis line with an arrow
plot + theme(
axis.line = element_line(arrow = arrow())
)
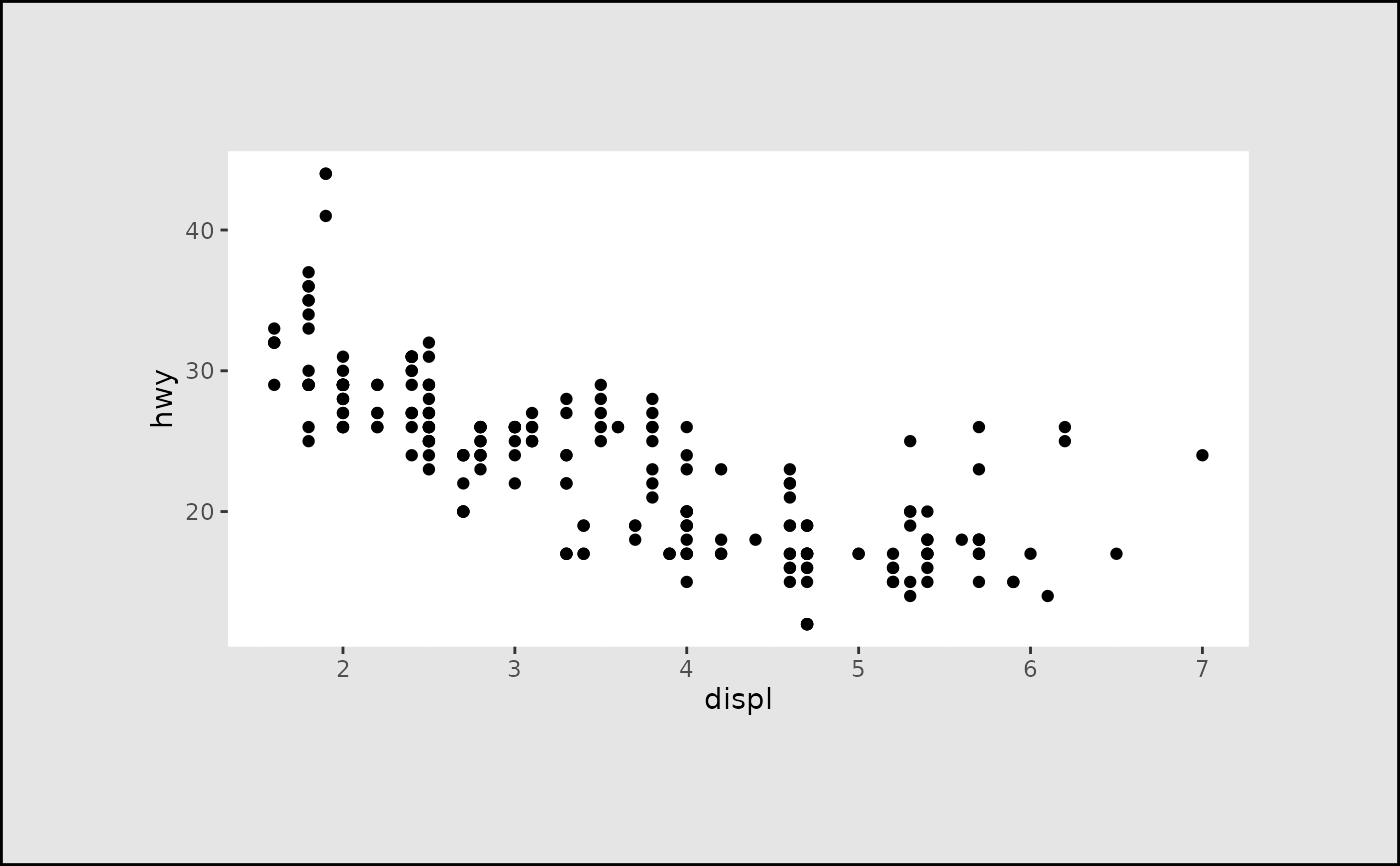
 plot + theme(
panel.background = element_rect(fill = "white"),
plot.margin = margin_auto(2, unit = "cm"),
plot.background = element_rect(
fill = "grey90",
colour = "black",
linewidth = 1
)
)
plot + theme(
panel.background = element_rect(fill = "white"),
plot.margin = margin_auto(2, unit = "cm"),
plot.background = element_rect(
fill = "grey90",
colour = "black",
linewidth = 1
)
)
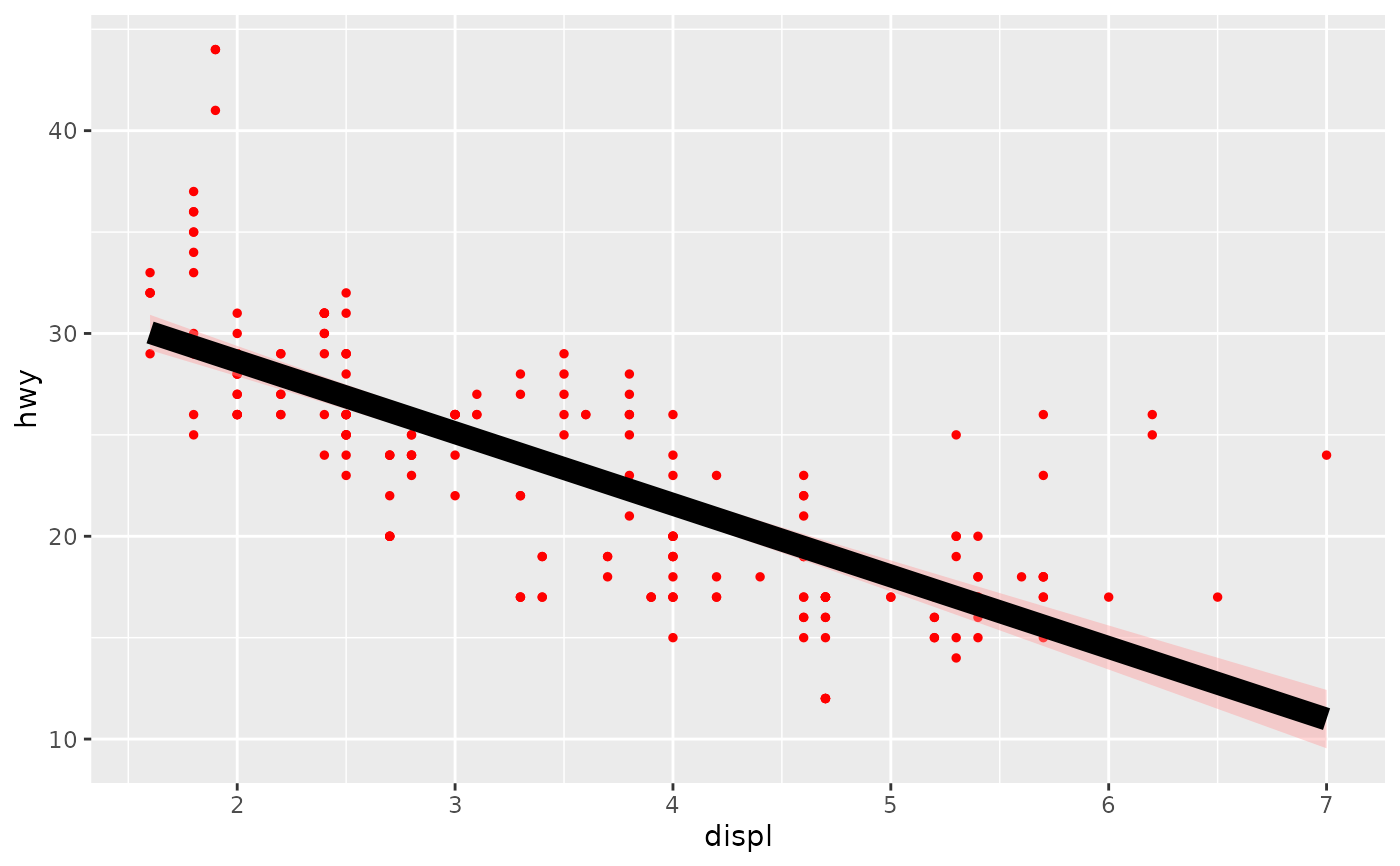
 ggplot(mpg, aes(displ, hwy)) +
geom_point() +
geom_smooth(formula = y ~ x, method = "lm") +
theme(geom = element_geom(
ink = "red", accent = "black",
pointsize = 1, linewidth = 2
))
ggplot(mpg, aes(displ, hwy)) +
geom_point() +
geom_smooth(formula = y ~ x, method = "lm") +
theme(geom = element_geom(
ink = "red", accent = "black",
pointsize = 1, linewidth = 2
))