Dodge overlapping objects side-to-side
Source:R/position-dodge.R, R/position-dodge2.R
position_dodge.RdDodging preserves the vertical position of an geom while adjusting the
horizontal position. position_dodge() requires the grouping variable to be
be specified in the global or geom_* layer. Unlike position_dodge(),
position_dodge2() works without a grouping variable in a layer.
position_dodge2() works with bars and rectangles, but is
particularly useful for arranging box plots, which
can have variable widths.
position_dodge(
  width = NULL,
  preserve = "total",
  orientation = "x",
  reverse = FALSE
)

position_dodge2(
  width = NULL,
  preserve = "total",
  padding = 0.1,
  reverse = FALSE
)
Arguments
- width
Dodging width, when different to the width of the individual elements. This is useful when you want to align narrow geoms with wider geoms. See the examples.
- preserve
Should dodging preserve the
"total"width of all elements at a position, or the width of a"single"element?- orientation
Fallback orientation when the layer or the data does not indicate an explicit orientation, like
geom_point(). Can be"x"(default) or"y".- reverse
If
TRUE, will reverse the default stacking order. This is useful if you're rotating both the plot and legend.- padding
Padding between elements at the same position. Elements are shrunk by this proportion to allow space between them. Defaults to 0.1.
See also
Other position adjustments:
position_identity(),
position_jitter(),
position_jitterdodge(),
position_nudge(),
position_stack()
Aesthetics
position_dodge() understands the following aesthetics. Required aesthetics are displayed in bold and defaults are displayed for optional aesthetics:
| • | order | → NULL |
Learn more about setting these aesthetics in vignette("ggplot2-specs").
Examples
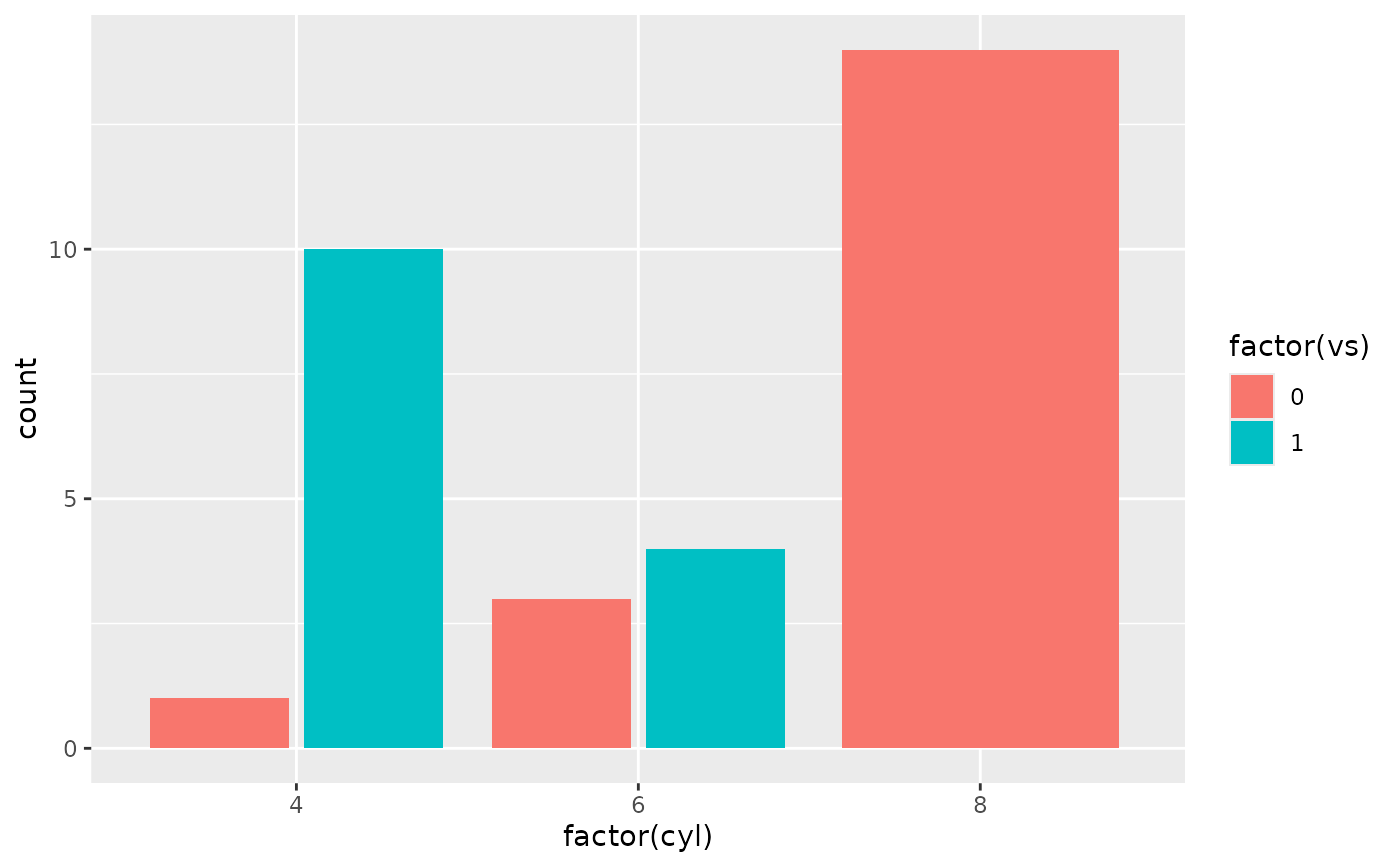
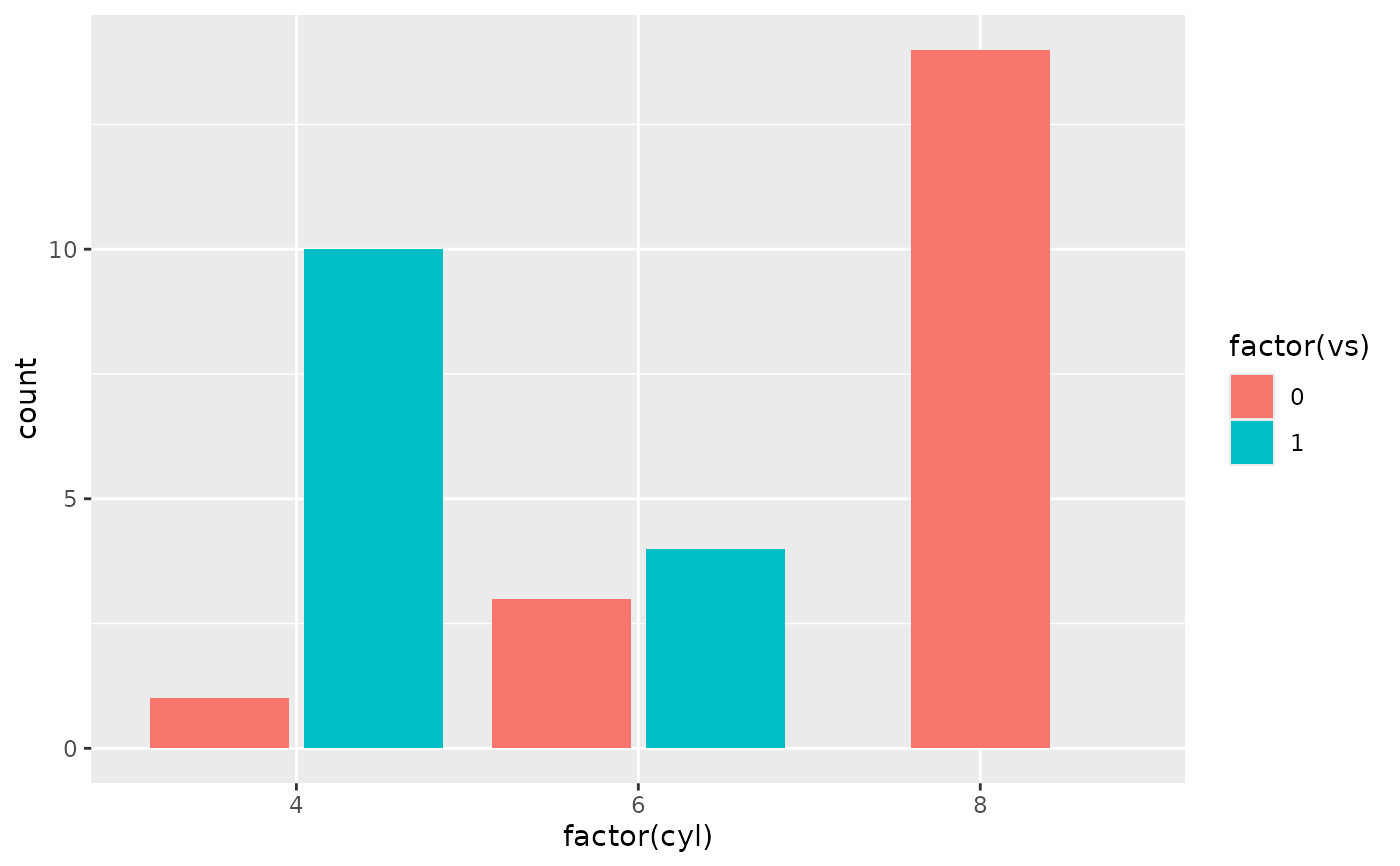
ggplot(mtcars, aes(factor(cyl), fill = factor(vs))) +
geom_bar(position = "dodge2")
 # By default, dodging with `position_dodge2()` preserves the total width of
# the elements. You can choose to preserve the width of each element with:
ggplot(mtcars, aes(factor(cyl), fill = factor(vs))) +
geom_bar(position = position_dodge2(preserve = "single"))
# By default, dodging with `position_dodge2()` preserves the total width of
# the elements. You can choose to preserve the width of each element with:
ggplot(mtcars, aes(factor(cyl), fill = factor(vs))) +
geom_bar(position = position_dodge2(preserve = "single"))
 # \donttest{
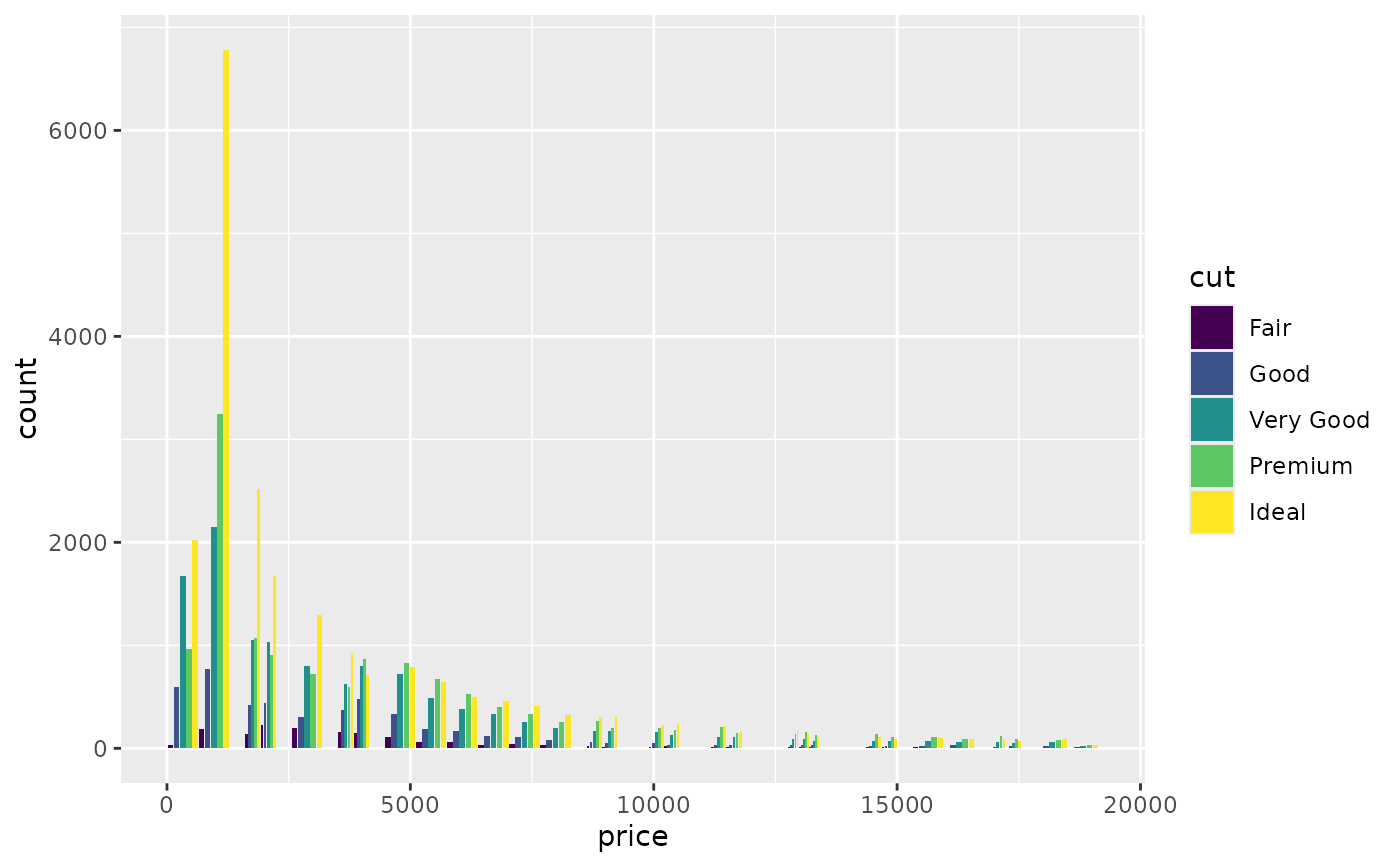
ggplot(diamonds, aes(price, fill = cut)) +
geom_histogram(position="dodge2")
#> `stat_bin()` using `bins = 30`. Pick better value `binwidth`.
# \donttest{
ggplot(diamonds, aes(price, fill = cut)) +
geom_histogram(position="dodge2")
#> `stat_bin()` using `bins = 30`. Pick better value `binwidth`.
 # see ?geom_bar for more examples
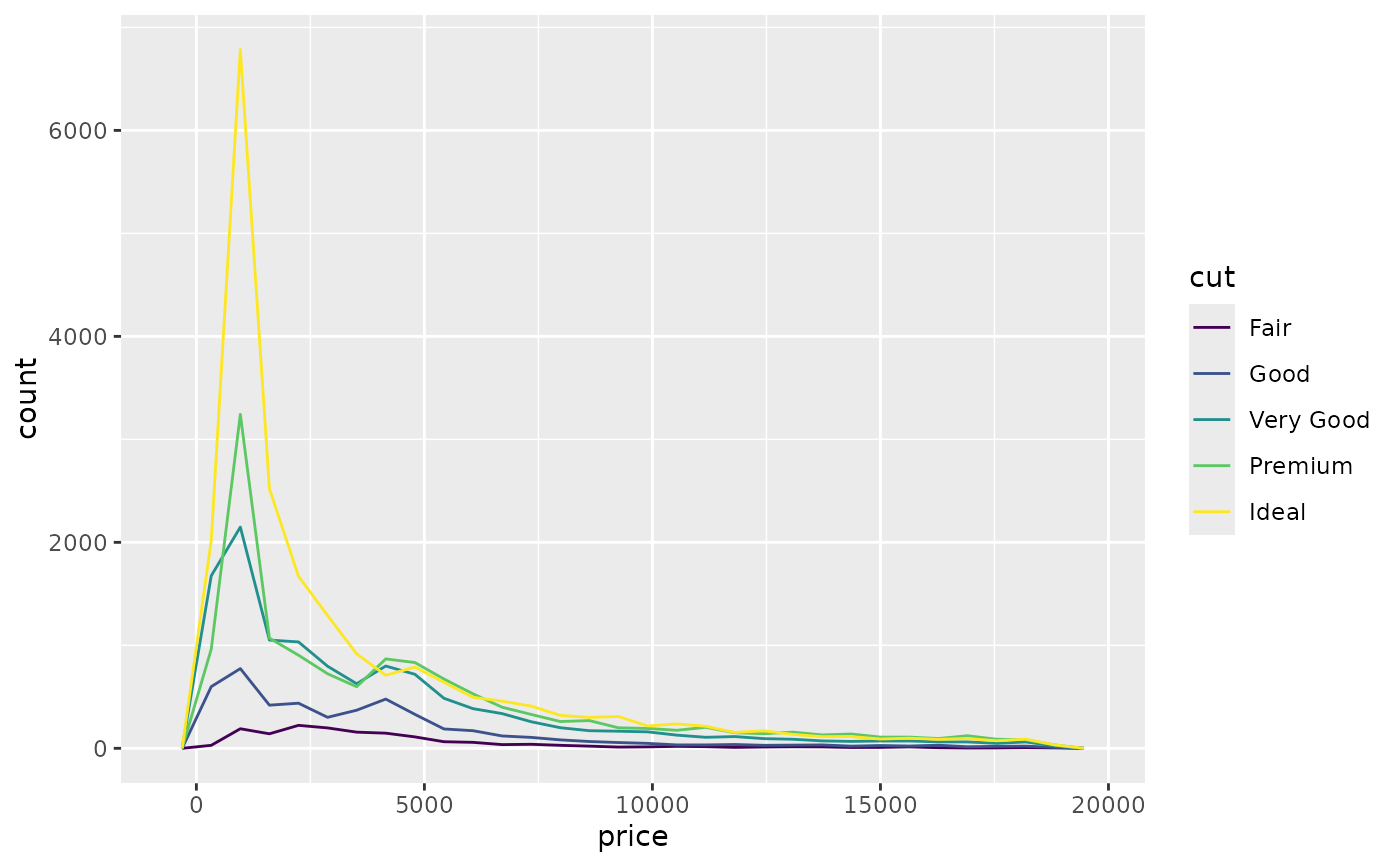
# In this case a frequency polygon is probably a better choice
ggplot(diamonds, aes(price, colour = cut)) +
geom_freqpoly()
#> `stat_bin()` using `bins = 30`. Pick better value `binwidth`.
# see ?geom_bar for more examples
# In this case a frequency polygon is probably a better choice
ggplot(diamonds, aes(price, colour = cut)) +
geom_freqpoly()
#> `stat_bin()` using `bins = 30`. Pick better value `binwidth`.
 # }
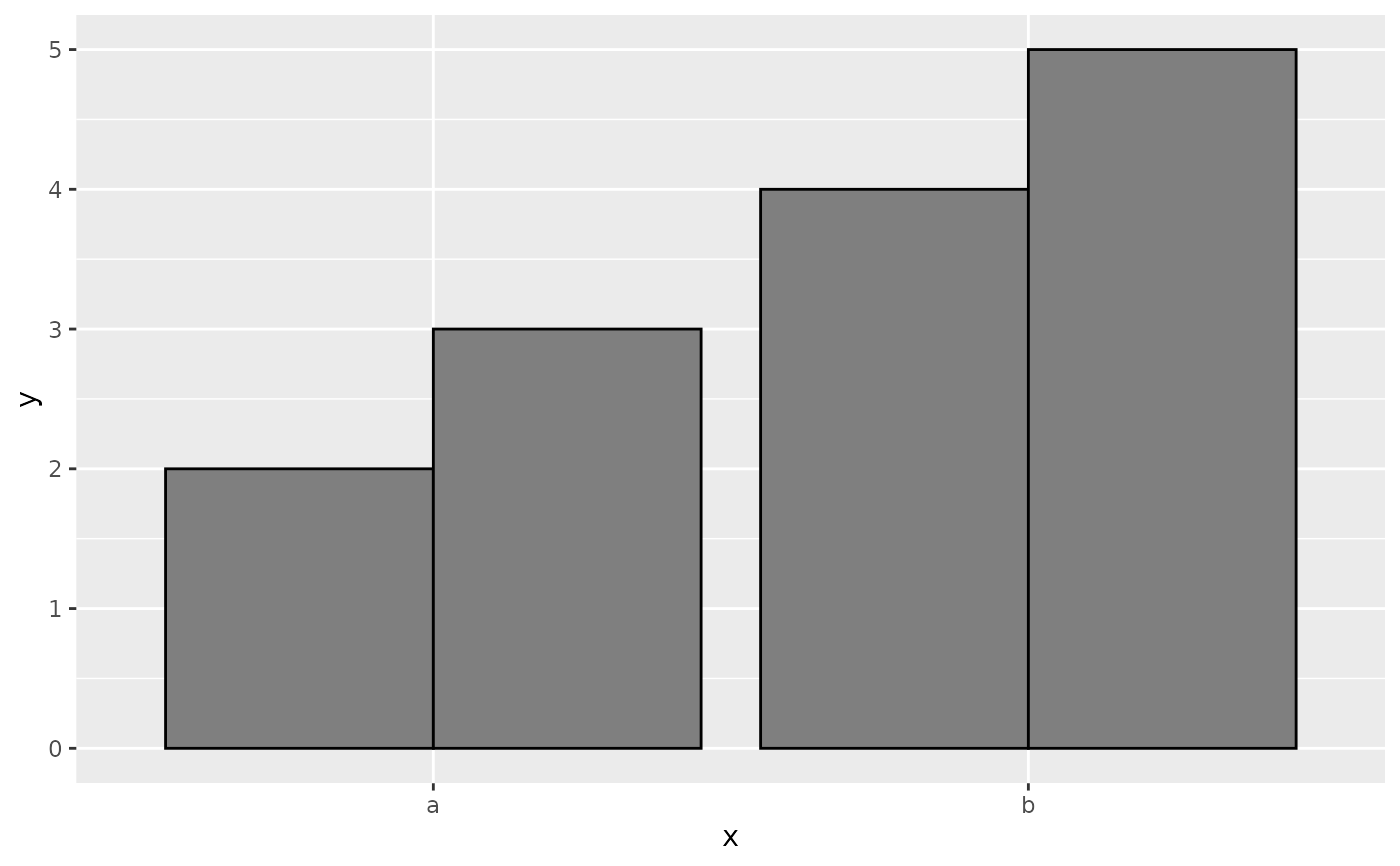
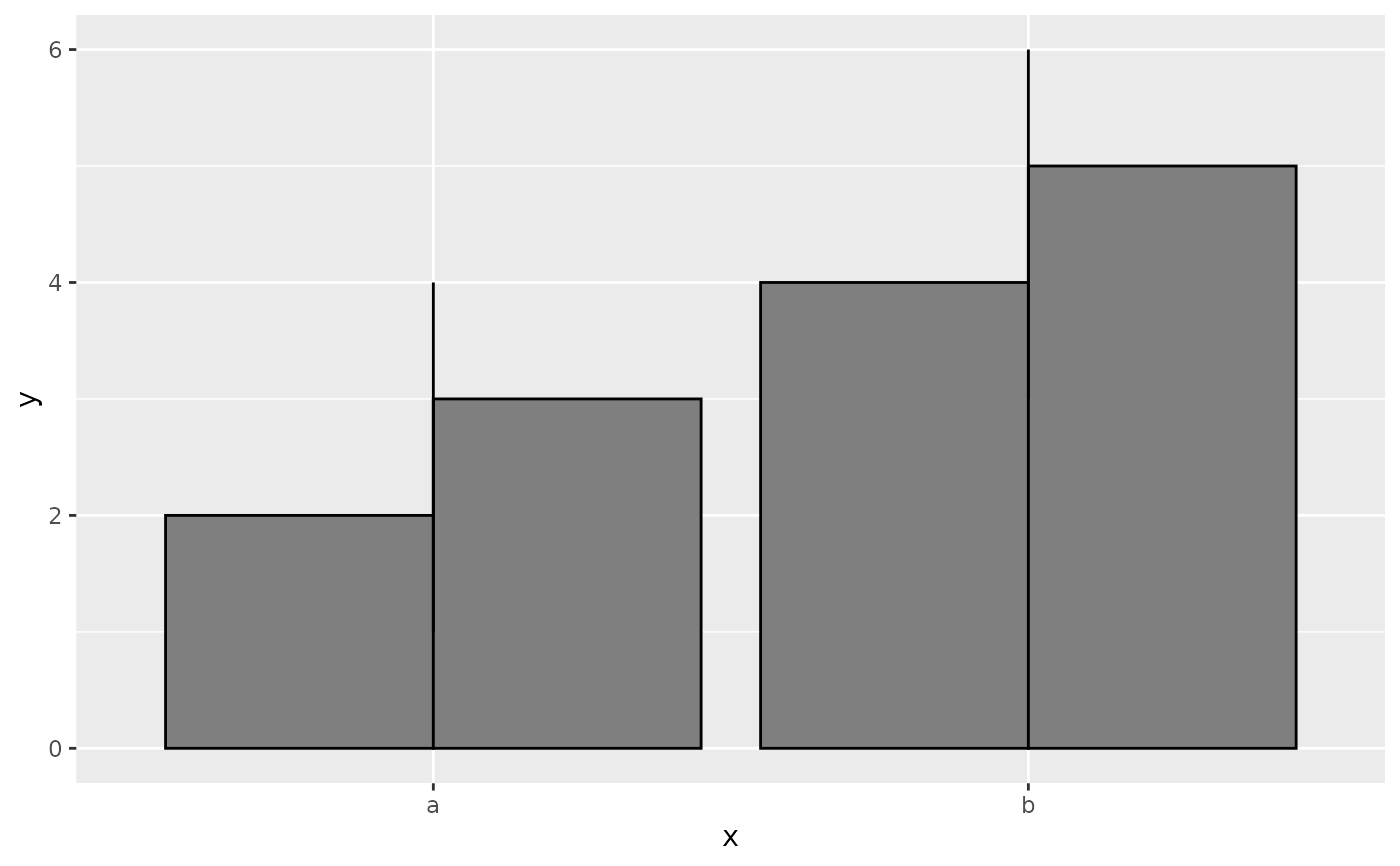
# Dodging with various widths -------------------------------------
# To dodge items with different widths, you need to be explicit
df <- data.frame(
x = c("a","a","b","b"),
y = 2:5,
g = rep(1:2, 2)
)
p <- ggplot(df, aes(x, y, group = g)) +
geom_col(position = "dodge", fill = "grey50", colour = "black")
p
# }
# Dodging with various widths -------------------------------------
# To dodge items with different widths, you need to be explicit
df <- data.frame(
x = c("a","a","b","b"),
y = 2:5,
g = rep(1:2, 2)
)
p <- ggplot(df, aes(x, y, group = g)) +
geom_col(position = "dodge", fill = "grey50", colour = "black")
p
 # A line range has no width:
p + geom_linerange(aes(ymin = y - 1, ymax = y + 1), position = "dodge")
#> Warning: Width not defined
#> ℹ Set with `position_dodge(width = ...)`
# A line range has no width:
p + geom_linerange(aes(ymin = y - 1, ymax = y + 1), position = "dodge")
#> Warning: Width not defined
#> ℹ Set with `position_dodge(width = ...)`
 # So you must explicitly specify the width
p + geom_linerange(
aes(ymin = y - 1, ymax = y + 1),
position = position_dodge(width = 0.9)
)
# So you must explicitly specify the width
p + geom_linerange(
aes(ymin = y - 1, ymax = y + 1),
position = position_dodge(width = 0.9)
)
 # The same principle applies to error bars, which are usually
# narrower than the bars
p + geom_errorbar(
aes(ymin = y - 1, ymax = y + 1),
width = 0.2,
position = "dodge"
)
# The same principle applies to error bars, which are usually
# narrower than the bars
p + geom_errorbar(
aes(ymin = y - 1, ymax = y + 1),
width = 0.2,
position = "dodge"
)
 p + geom_errorbar(
aes(ymin = y - 1, ymax = y + 1),
width = 0.2,
position = position_dodge(width = 0.9)
)
p + geom_errorbar(
aes(ymin = y - 1, ymax = y + 1),
width = 0.2,
position = position_dodge(width = 0.9)
)
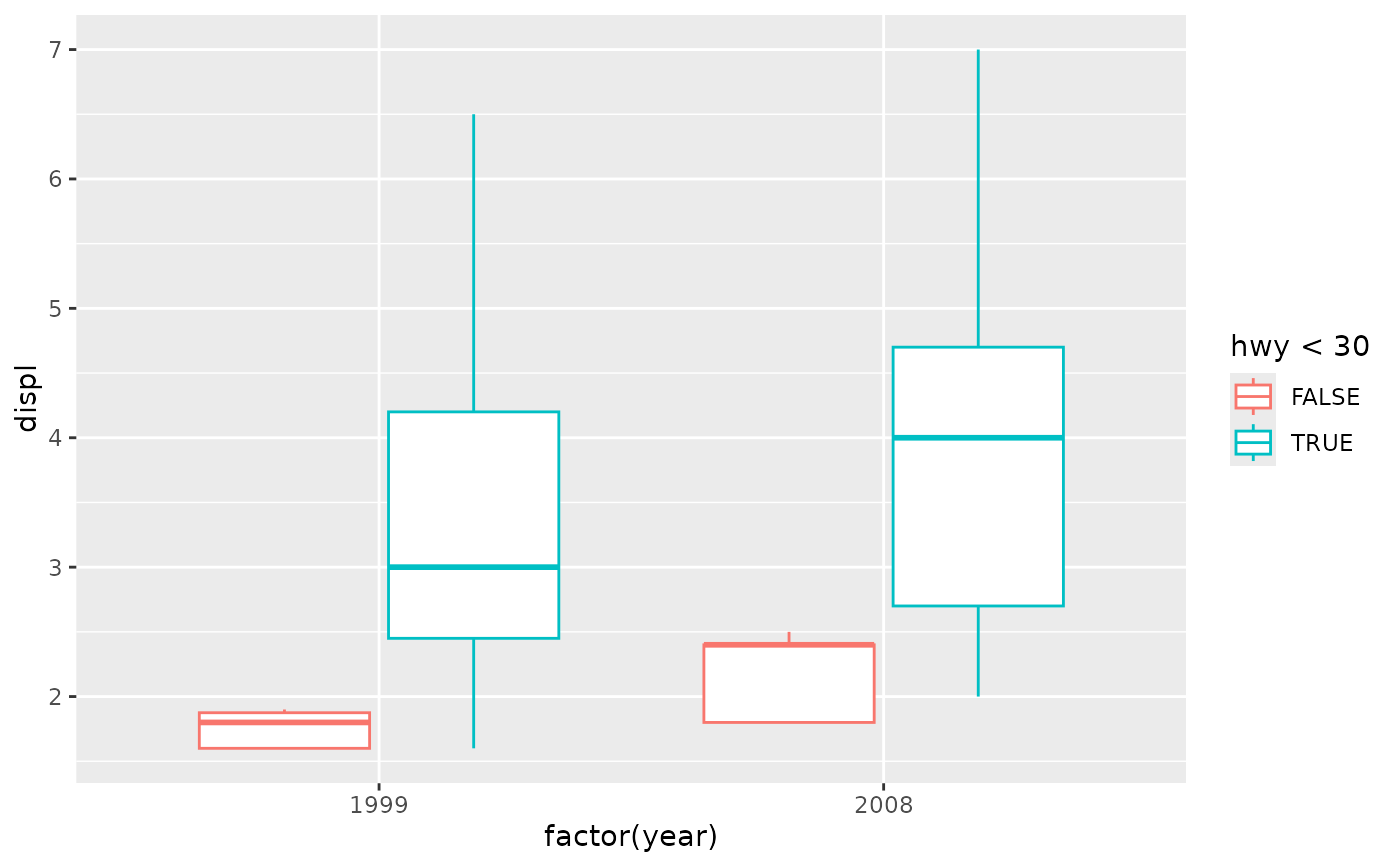
 # Box plots use position_dodge2 by default, and bars can use it too
ggplot(mpg, aes(factor(year), displ)) +
geom_boxplot(aes(colour = hwy < 30))
# Box plots use position_dodge2 by default, and bars can use it too
ggplot(mpg, aes(factor(year), displ)) +
geom_boxplot(aes(colour = hwy < 30))
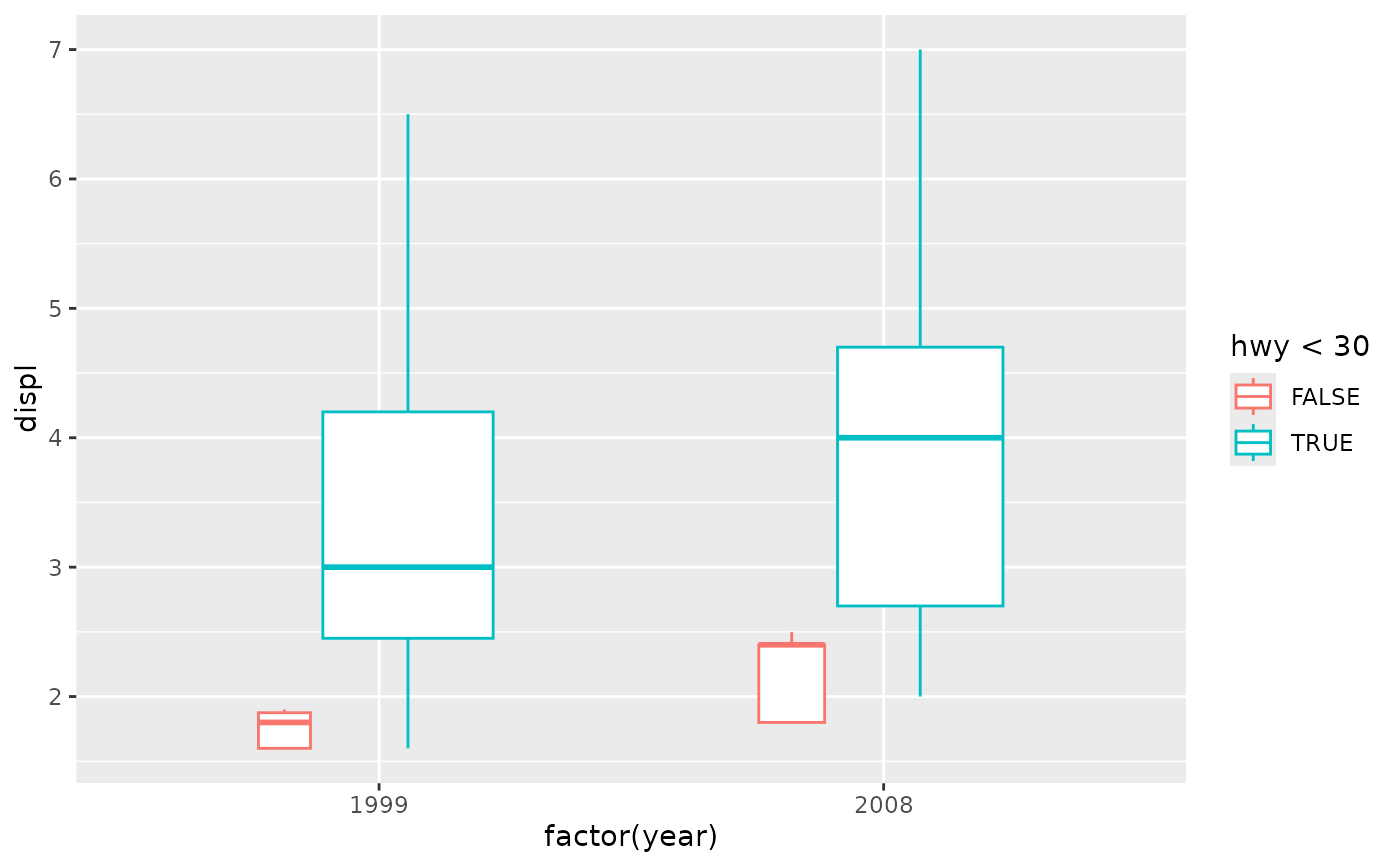
 ggplot(mpg, aes(factor(year), displ)) +
geom_boxplot(aes(colour = hwy < 30), varwidth = TRUE)
ggplot(mpg, aes(factor(year), displ)) +
geom_boxplot(aes(colour = hwy < 30), varwidth = TRUE)
 ggplot(mtcars, aes(factor(cyl), fill = factor(vs))) +
geom_bar(position = position_dodge2(preserve = "single"))
ggplot(mtcars, aes(factor(cyl), fill = factor(vs))) +
geom_bar(position = position_dodge2(preserve = "single"))
 ggplot(mtcars, aes(factor(cyl), fill = factor(vs))) +
geom_bar(position = position_dodge2(preserve = "total"))
ggplot(mtcars, aes(factor(cyl), fill = factor(vs))) +
geom_bar(position = position_dodge2(preserve = "total"))
