scale_x_discrete() and scale_y_discrete() are used to set the values for
discrete x and y scale aesthetics. For simple manipulation of scale labels
and limits, you may wish to use labs() and lims() instead.
scale_x_discrete(
  name = waiver(),
  ...,
  palette = seq_len,
  expand = waiver(),
  guide = waiver(),
  position = "bottom",
  sec.axis = waiver(),
  continuous.limits = NULL
)

scale_y_discrete(
  name = waiver(),
  ...,
  palette = seq_len,
  expand = waiver(),
  guide = waiver(),
  position = "left",
  sec.axis = waiver(),
  continuous.limits = NULL
)
Arguments
- name
The name of the scale. Used as the axis or legend title. If
waiver(), the default, the name of the scale is taken from the first mapping used for that aesthetic. IfNULL, the legend title will be omitted.- ...
Arguments passed on to
discrete_scalebreaksOne of:
limitsOne of:
NULLto use the default scale valuesA character vector that defines possible values of the scale and their order
A function that accepts the existing (automatic) values and returns new ones. Also accepts rlang lambda function notation.
dropShould unused factor levels be omitted from the scale? The default,
TRUE, uses the levels that appear in the data;FALSEincludes the levels in the factor. Please note that to display every level in a legend, the layer should useshow.legend = TRUE.na.translateUnlike continuous scales, discrete scales can easily show missing values, and do so by default. If you want to remove missing values from a discrete scale, specify
na.translate = FALSE.na.valueIf
na.translate = TRUE, what aesthetic value should the missing values be displayed as? Does not apply to position scales whereNAis always placed at the far right.aestheticsThe names of the aesthetics that this scale works with.
minor_breaksOne of:
NULLfor no minor breakswaiver()for the default breaks (none for discrete, one minor break between each major break for continuous)A numeric vector of positions
A function that given the limits returns a vector of minor breaks. Also accepts rlang lambda function notation. When the function has two arguments, it will be given the limits and major break positions.
labelsOne of the options below. Please note that when
labelsis a vector, it is highly recommended to also set thebreaksargument as a vector to protect against unintended mismatches.NULLfor no labelswaiver()for the default labels computed by the transformation objectA character vector giving labels (must be same length as
breaks)An expression vector (must be the same length as breaks). See ?plotmath for details.
A function that takes the breaks as input and returns labels as output. Also accepts rlang lambda function notation.
callThe
callused to construct the scale for reporting messages.superThe super class to use for the constructed scale
- palette
A palette function that when called with a single integer argument (the number of levels in the scale) returns the numerical values that they should take.
- expand
For position scales, a vector of range expansion constants used to add some padding around the data to ensure that they are placed some distance away from the axes. Use the convenience function
expansion()to generate the values for theexpandargument. The defaults are to expand the scale by 5% on each side for continuous variables, and by 0.6 units on each side for discrete variables.- guide
A function used to create a guide or its name. See
guides()for more information.- position
For position scales, The position of the axis.
leftorrightfor y axes,toporbottomfor x axes.- sec.axis
dup_axis()is used to specify a secondary axis.- continuous.limits
One of:
NULLto use the default scale rangeA numeric vector of length two providing a display range for the scale. Use
NAto refer to the existing minimum or maximum.A function that accepts the limits and returns a numeric vector of length two.
Details
You can use continuous positions even with a discrete position scale - this allows you (e.g.) to place labels between bars in a bar chart. Continuous positions are numeric values starting at one for the first level, and increasing by one for each level (i.e. the labels are placed at integer positions). This is what allows jittering to work.
See also
The discrete position scales section of the online ggplot2 book.
Other position scales:
scale_x_binned(),
scale_x_continuous(),
scale_x_date()
Examples
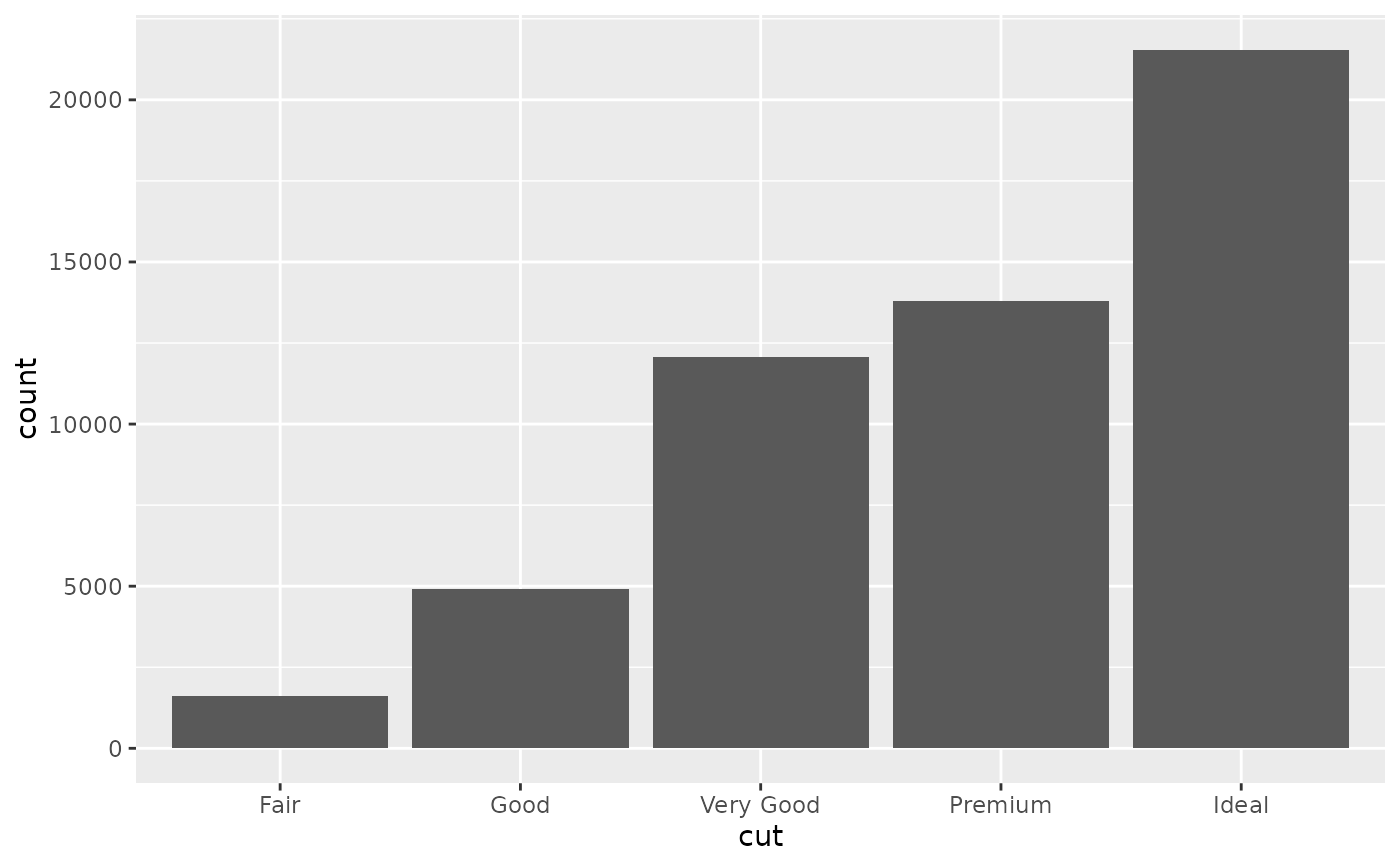
ggplot(diamonds, aes(cut)) + geom_bar()
 # \donttest{
# The discrete position scale is added automatically whenever you
# have a discrete position.
(d <- ggplot(subset(diamonds, carat > 1), aes(cut, clarity)) +
geom_jitter())
# \donttest{
# The discrete position scale is added automatically whenever you
# have a discrete position.
(d <- ggplot(subset(diamonds, carat > 1), aes(cut, clarity)) +
geom_jitter())
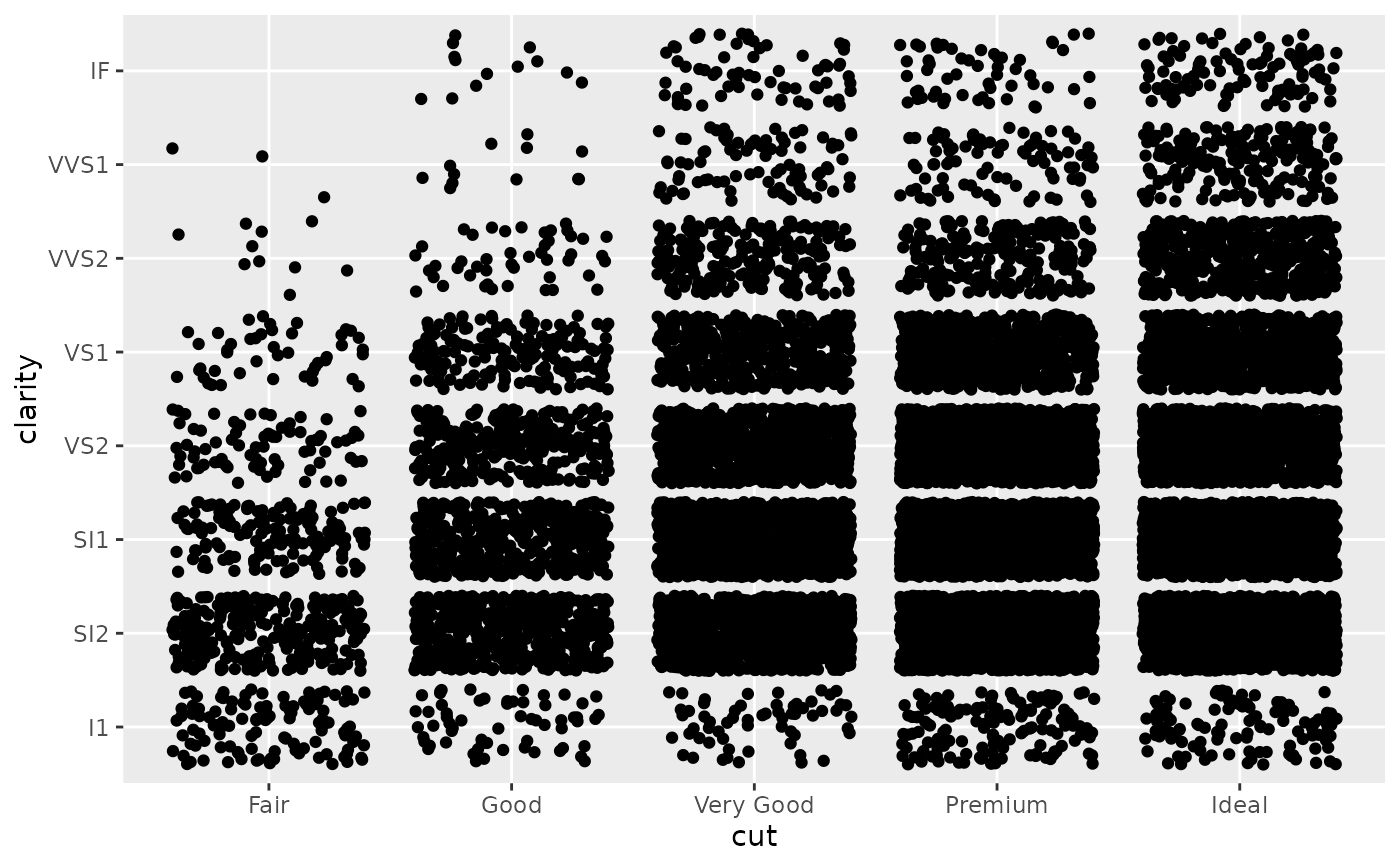 d + scale_x_discrete("Cut")
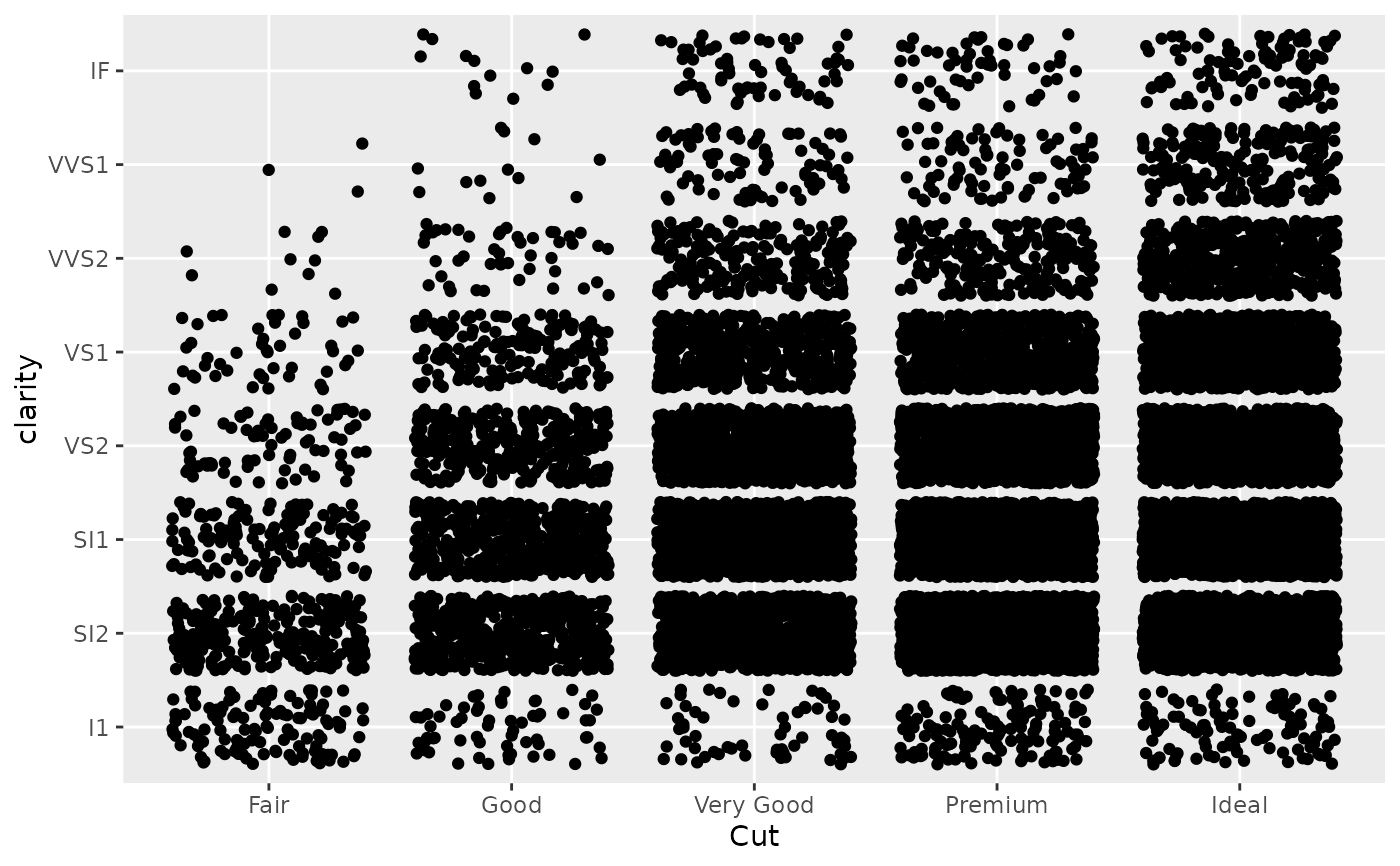 d +
scale_x_discrete(
"Cut",
labels = c(
"Fair" = "F",
"Good" = "G",
"Very Good" = "VG",
"Perfect" = "P",
"Ideal" = "I"
)
)
d +
scale_x_discrete(
"Cut",
labels = c(
"Fair" = "F",
"Good" = "G",
"Very Good" = "VG",
"Perfect" = "P",
"Ideal" = "I"
)
)
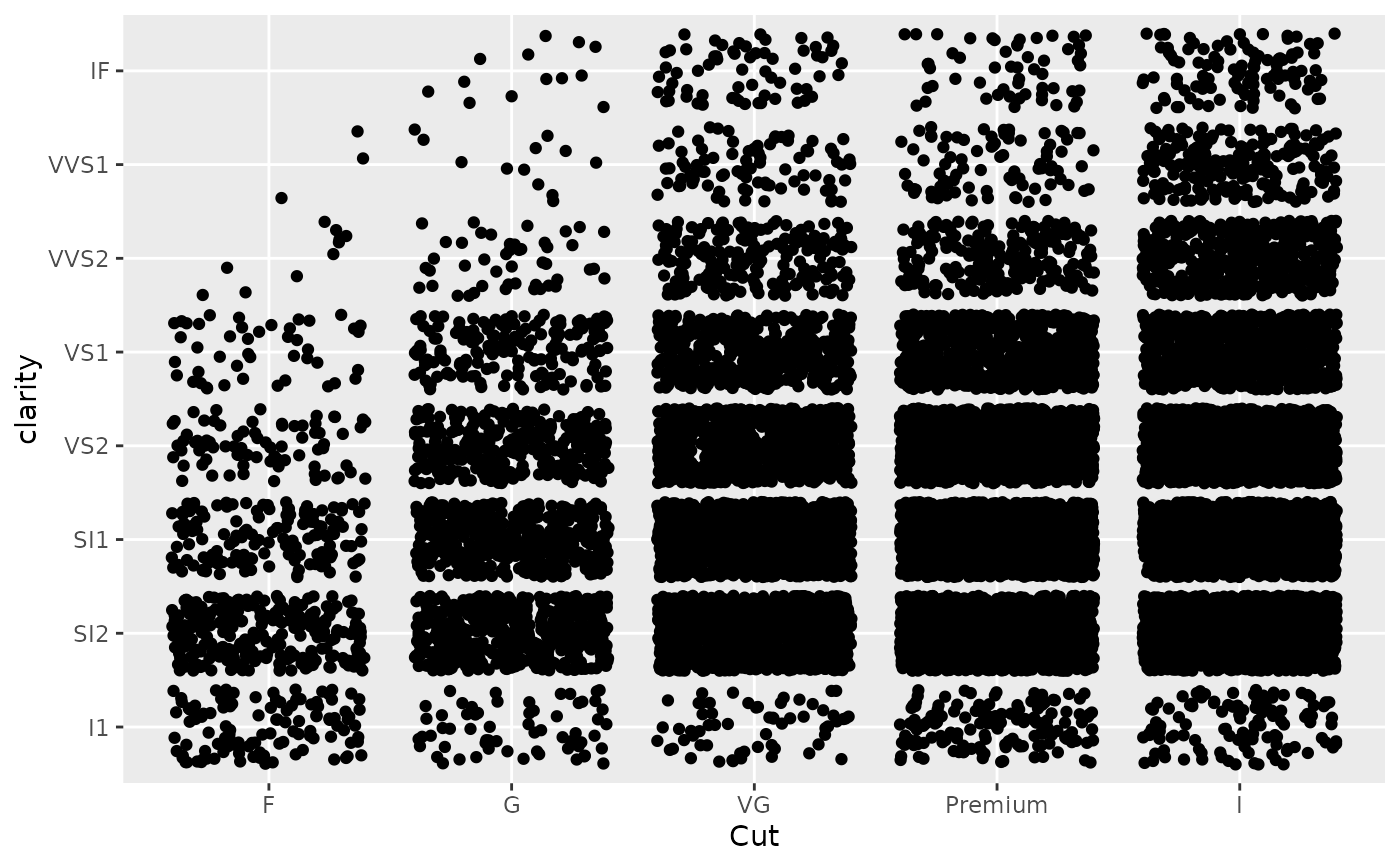 # Use limits to adjust the which levels (and in what order)
# are displayed
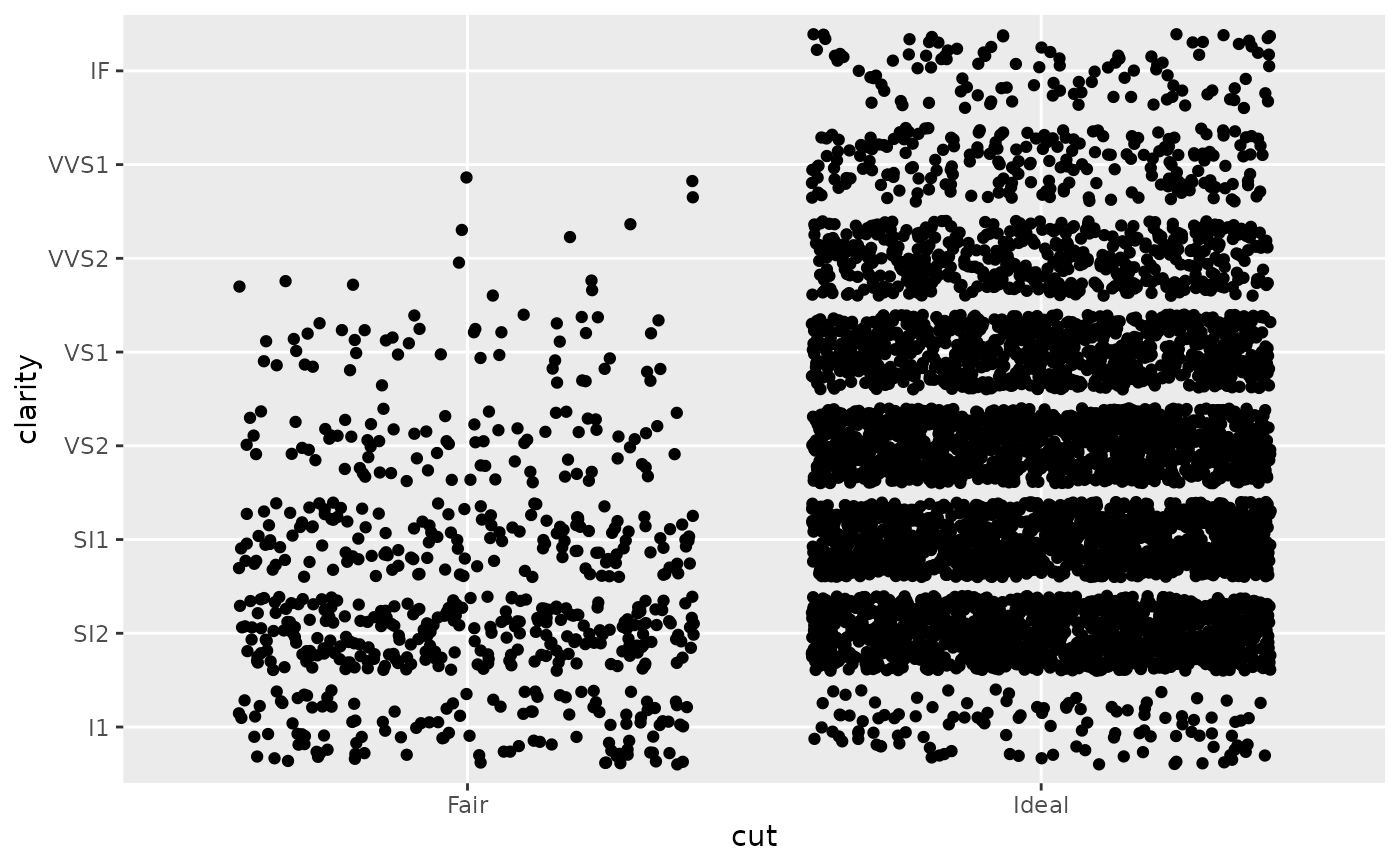
d + scale_x_discrete(limits = c("Fair","Ideal"))
#> Warning: Removed 11189 rows containing missing values or values outside the scale range
#> (`geom_point()`).
# Use limits to adjust the which levels (and in what order)
# are displayed
d + scale_x_discrete(limits = c("Fair","Ideal"))
#> Warning: Removed 11189 rows containing missing values or values outside the scale range
#> (`geom_point()`).
 # you can also use the short hand functions xlim and ylim
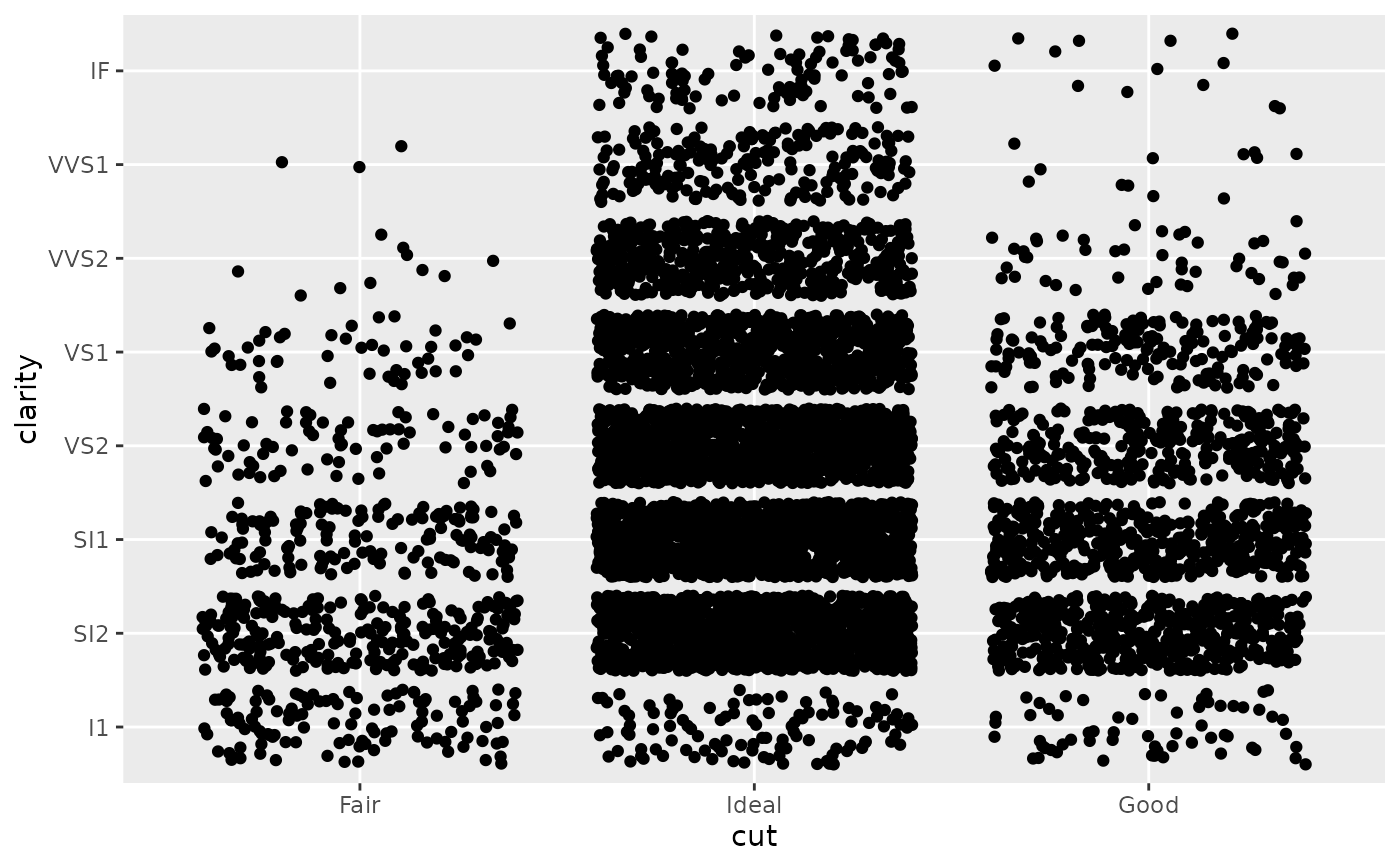
d + xlim("Fair","Ideal", "Good")
#> Warning: Removed 9610 rows containing missing values or values outside the scale range
#> (`geom_point()`).
# you can also use the short hand functions xlim and ylim
d + xlim("Fair","Ideal", "Good")
#> Warning: Removed 9610 rows containing missing values or values outside the scale range
#> (`geom_point()`).
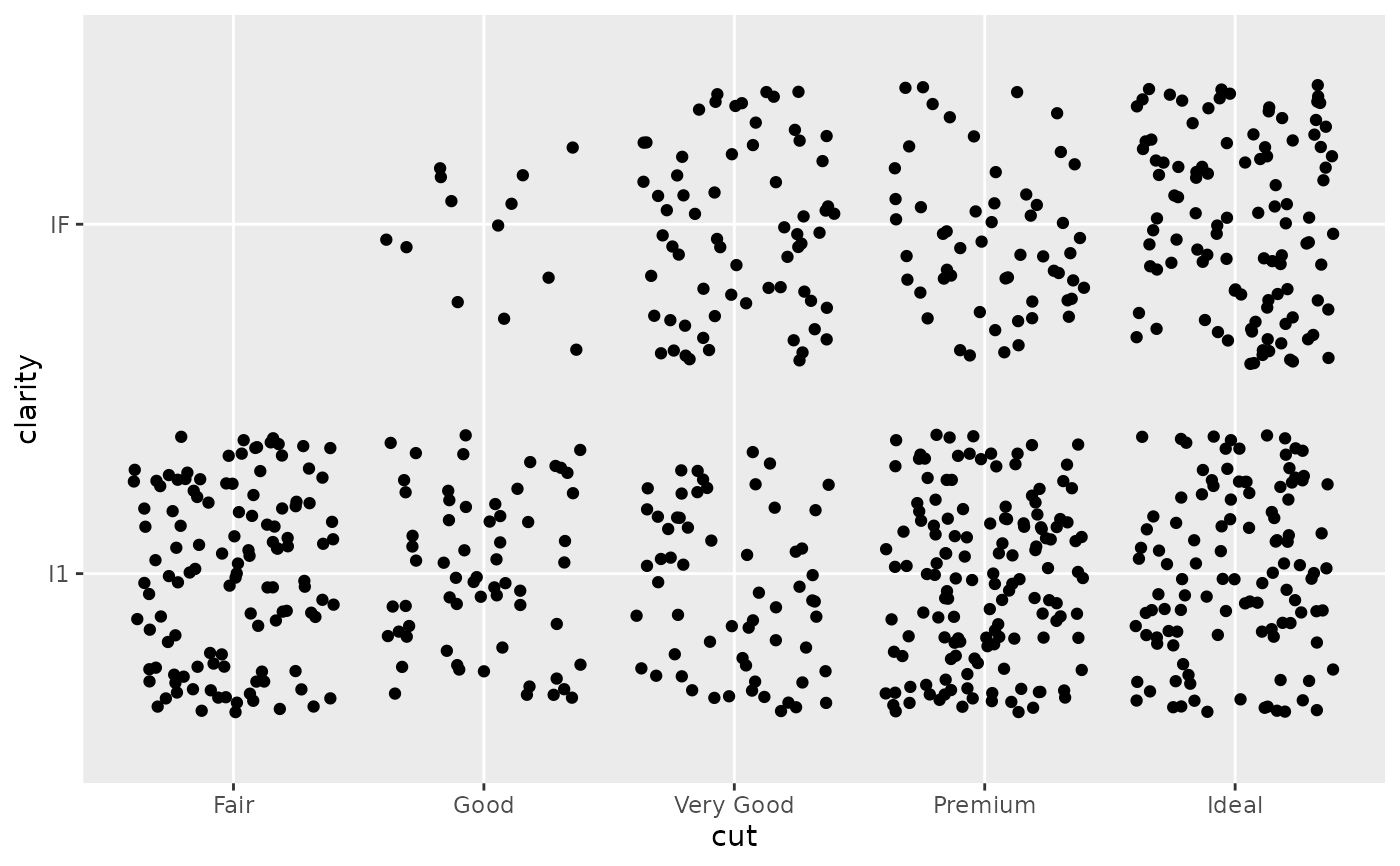
 d + ylim("I1", "IF")
#> Warning: Removed 16770 rows containing missing values or values outside the scale range
#> (`geom_point()`).
d + ylim("I1", "IF")
#> Warning: Removed 16770 rows containing missing values or values outside the scale range
#> (`geom_point()`).
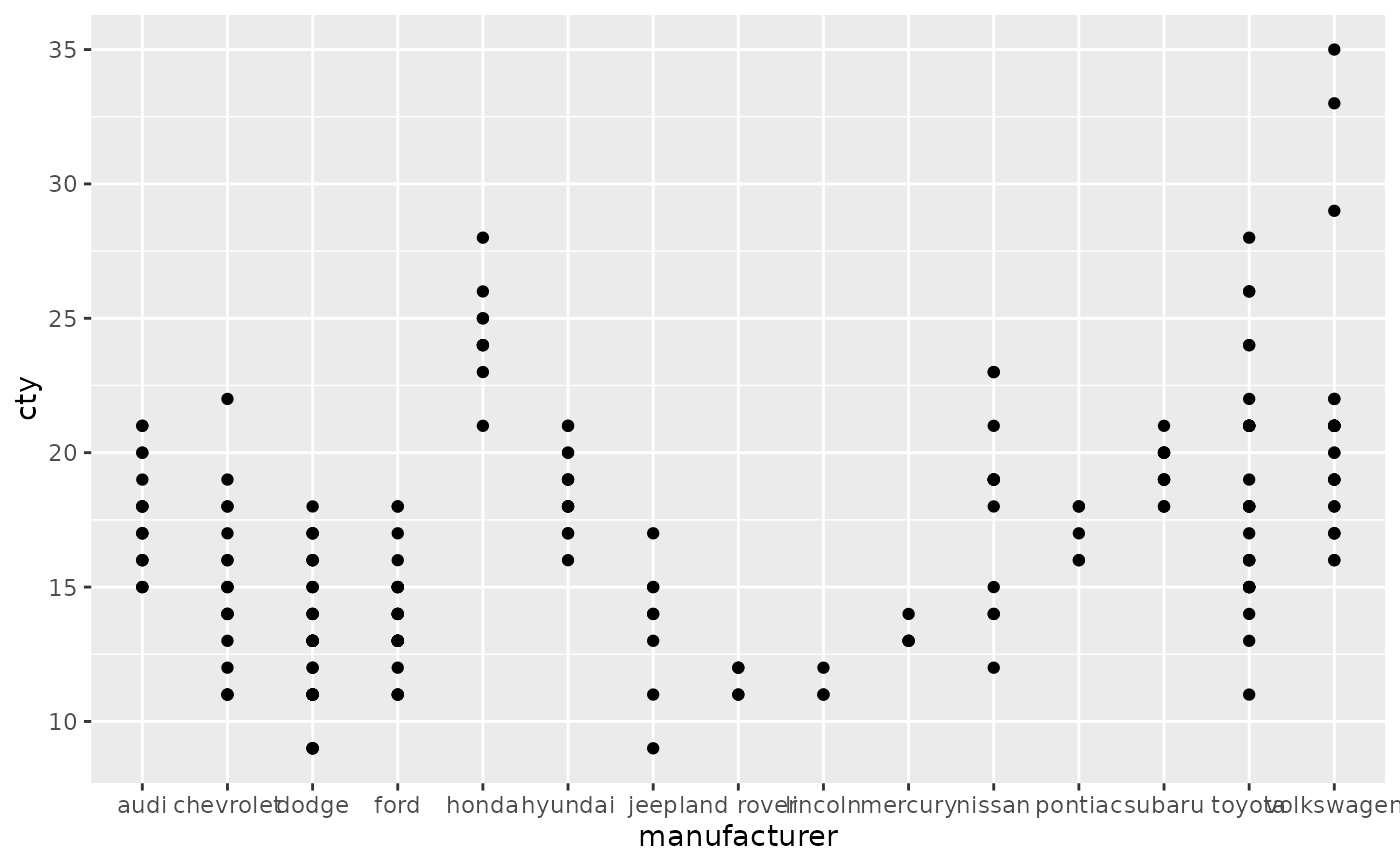
 # See ?reorder to reorder based on the values of another variable
ggplot(mpg, aes(manufacturer, cty)) +
geom_point()
# See ?reorder to reorder based on the values of another variable
ggplot(mpg, aes(manufacturer, cty)) +
geom_point()
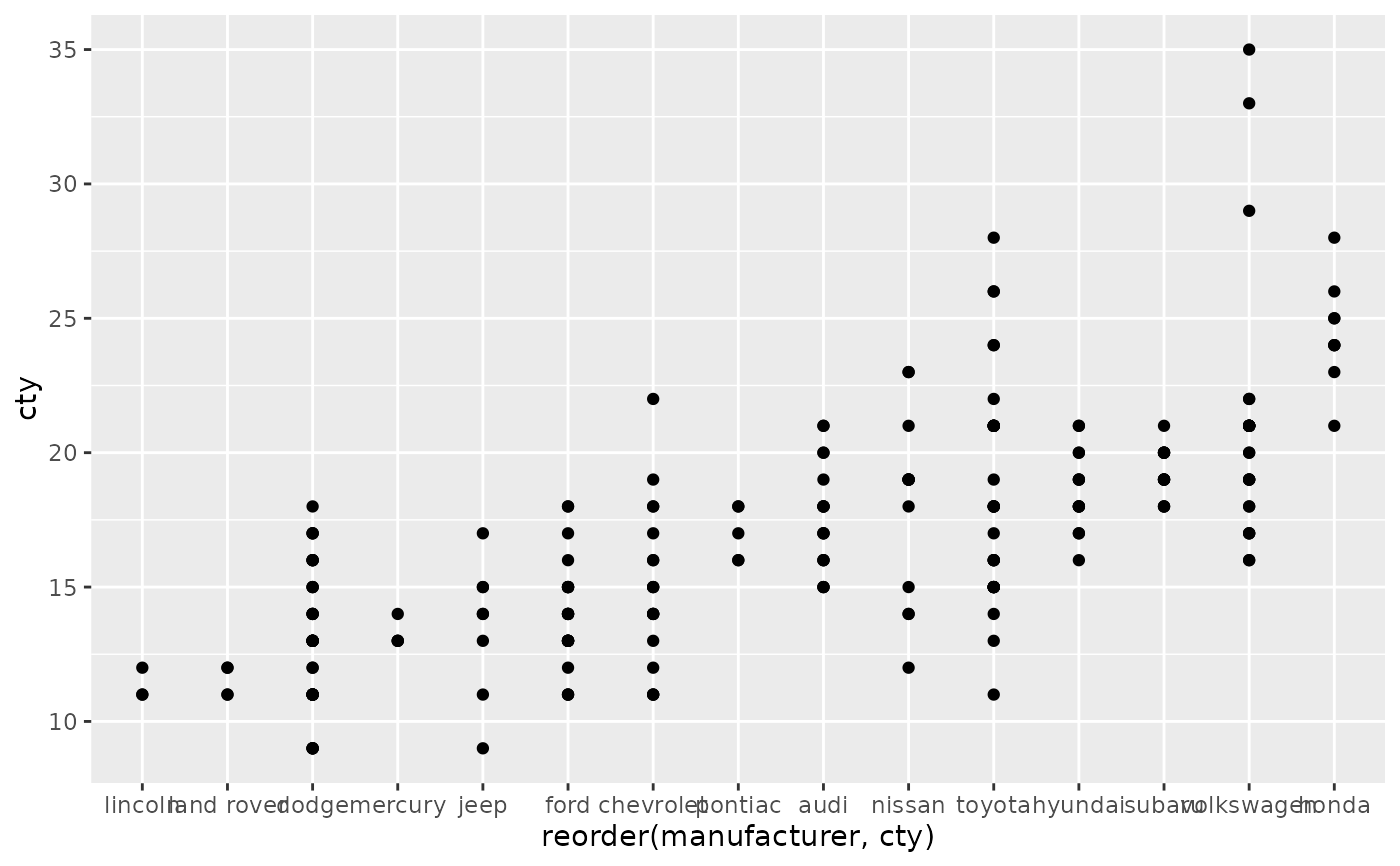
 ggplot(mpg, aes(reorder(manufacturer, cty), cty)) +
geom_point()
ggplot(mpg, aes(reorder(manufacturer, cty), cty)) +
geom_point()
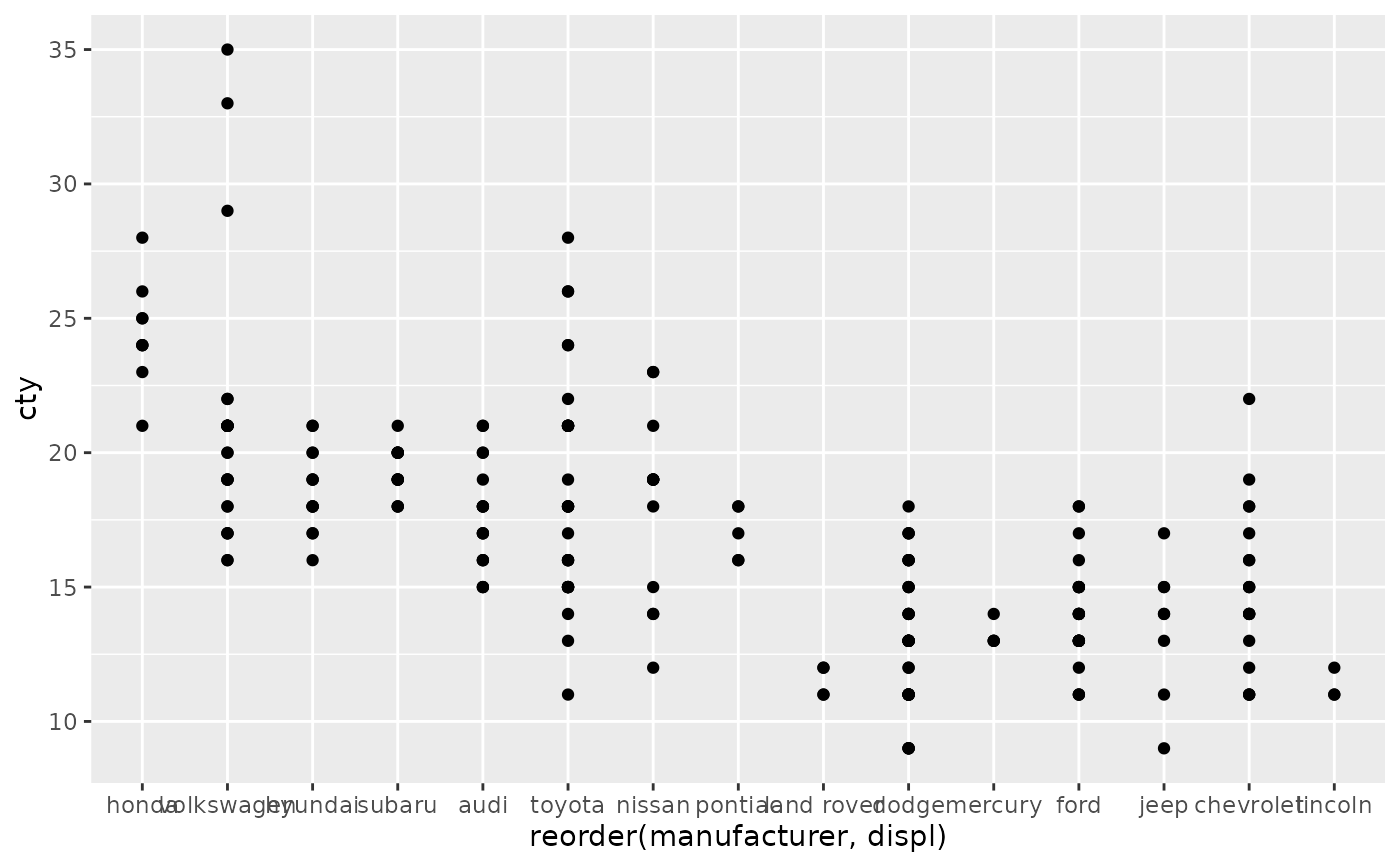
 ggplot(mpg, aes(reorder(manufacturer, displ), cty)) +
geom_point()
ggplot(mpg, aes(reorder(manufacturer, displ), cty)) +
geom_point()
 # Use abbreviate as a formatter to reduce long names
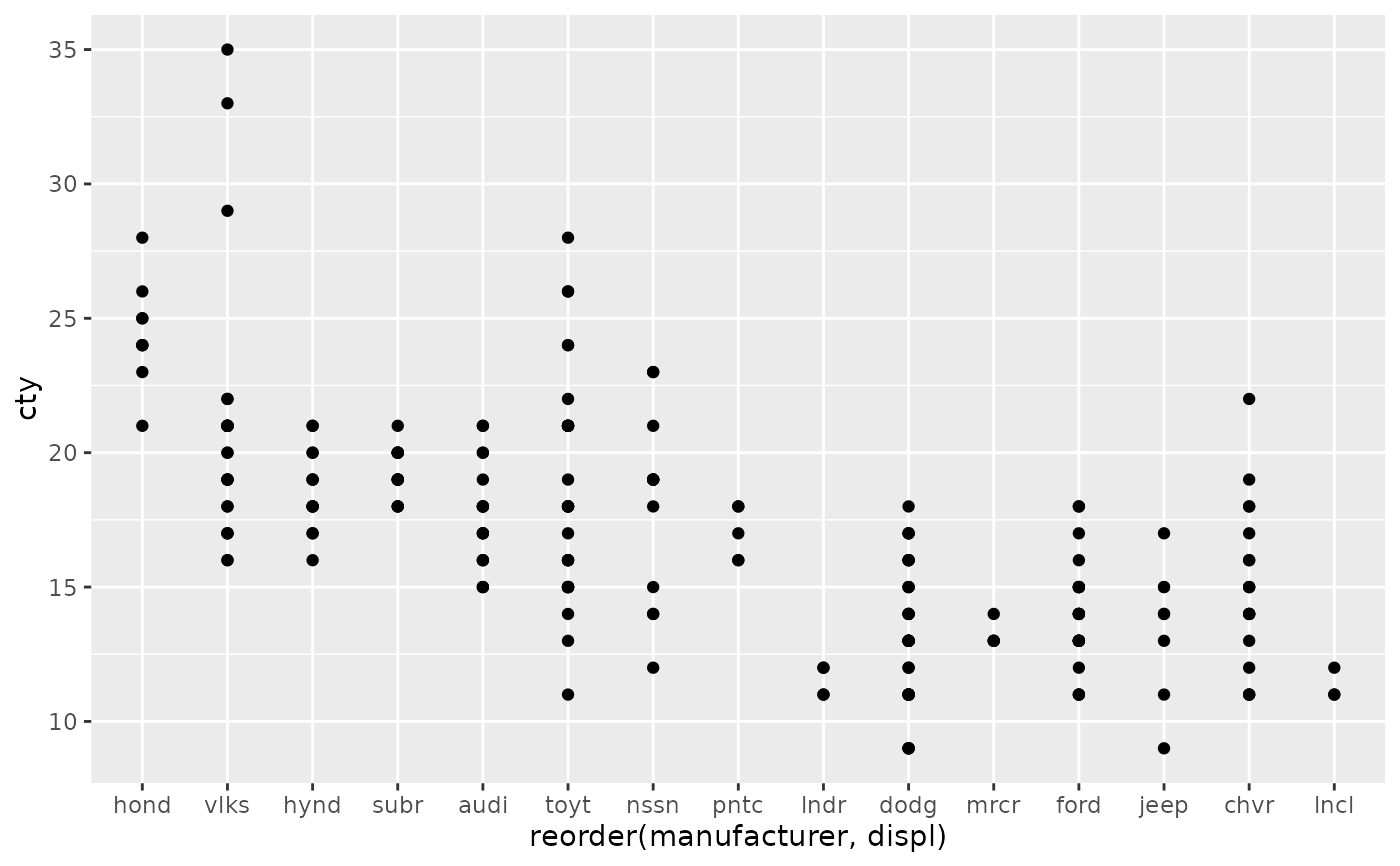
ggplot(mpg, aes(reorder(manufacturer, displ), cty)) +
geom_point() +
scale_x_discrete(labels = abbreviate)
# Use abbreviate as a formatter to reduce long names
ggplot(mpg, aes(reorder(manufacturer, displ), cty)) +
geom_point() +
scale_x_discrete(labels = abbreviate)
 # }
# }