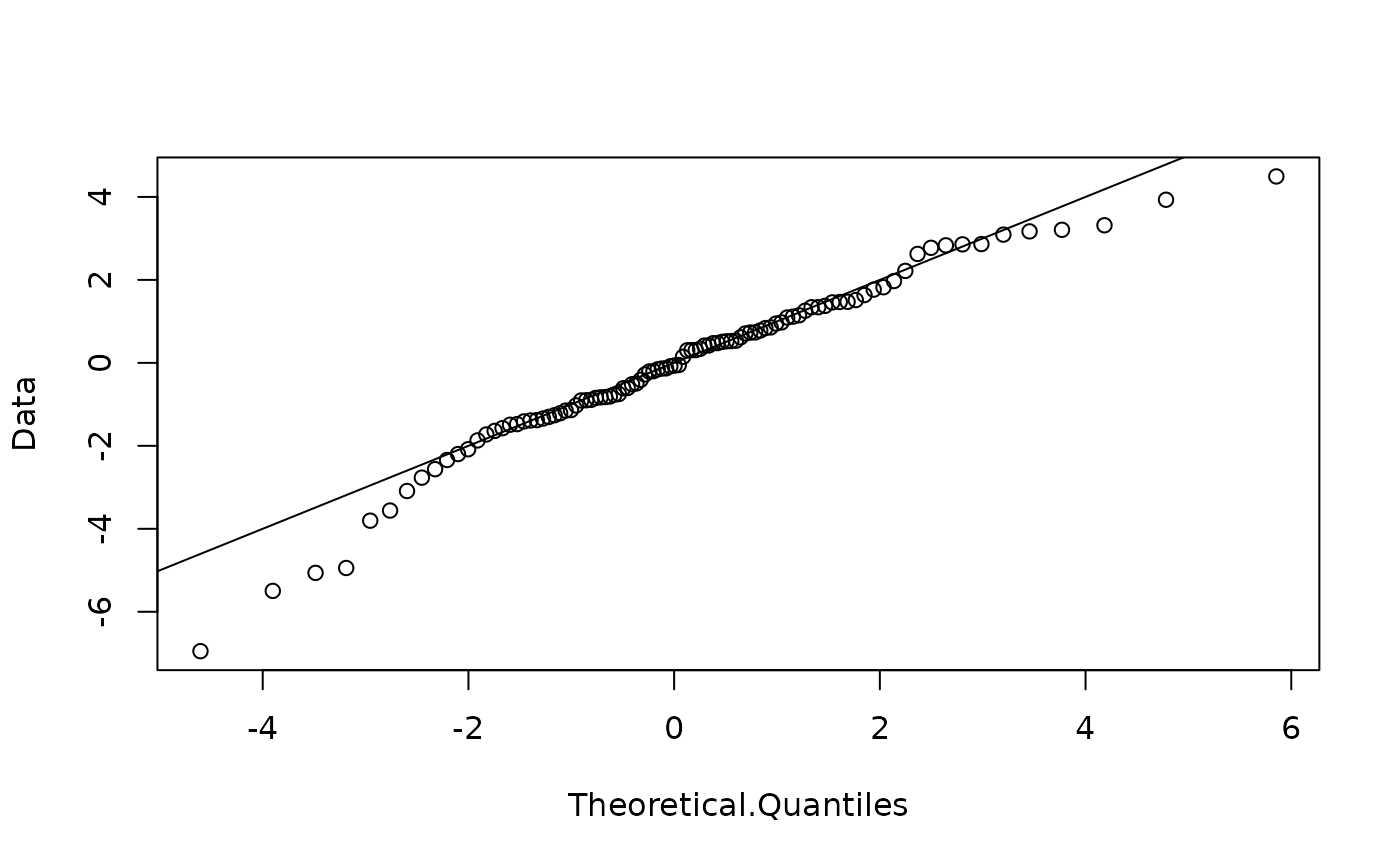
Quantile-Quantile plot against the generalised lambda distribution
qqgl.Rdqqgl produces a Quantile-Quantile plot of data against the
generalised lambda distribution, or a Q-Q plot to compare two sets of parameter values
for the generalised lambda distribution. It does for the generalised lambda
distribution what qqnorm does for the normal.
qqgl(y = NULL, lambda1 = 0, lambda2 = NULL, lambda3 = NULL, lambda4 = NULL,
  param = "fkml", lambda5 = NULL, abline = TRUE, lambda.pars1 = NULL, lambda.pars2 = NULL,
  param2 = "fkml", points.for.2.param.sets = 4000, ...)
Arguments
- y
The data sample
- lambda1
This can be either a single numeric value or a vector. If it is a vector, it must be of length 4 for parameterisations
fmklorrsand of length 5 for parameterisationfm5. If it is a vector, it gives all the parameters of the generalised lambda distribution (see below for details) and the otherlambdaarguments must be left as NULL.Alternatively, leave
lambda1as the default value of 0 and use thelambda.pars1argument instead.If it is a a single value, it is \(\lambda_1\), the location parameter of the distribution and the other parameters are given by the following arguments
Note that the numbering of the \(\lambda\) parameters for the fmkl parameterisation is different to that used by Freimer, Mudholkar, Kollia and Lin.
- lambda2
\(\lambda_2\) - scale parameter
- lambda3
\(\lambda_3\) - first shape parameter
- lambda4
\(\lambda_4\) - second shape parameter
- lambda5
\(\lambda_5\) - a skewing parameter, in the fm5 parameterisation
- param
choose parameterisation:
fmkluses Freimer, Mudholkar, Kollia and Lin (1988) (default).rsuses Ramberg and Schmeiser (1974)fm5uses the 5 parameter version of the FMKL parameterisation (paper to appear)- abline
A logical value, TRUE adds a line through the origian with a slope of 1 to the plot
- lambda.pars1
Parameters of the generalised lambda distribution (see
lambda1tolambda4for details.- lambda.pars2
Second set of parameters of the generalised lambda distribution (see
lambda1tolambda4for details. Uselambda.pars1andlambda.pars2to produce a QQ plot comparing two generalised lambda distributions- param2
parameterisation to use for the second set of parameter values
- points.for.2.param.sets
Number of quantiles to use in a Q-Q plot comparing two sets of parameter values
- ...
graphical parameters, passed to
qqplot
Details
See gld for more details on the Generalised Lambda
Distribution. A Q-Q plot provides a way to visually assess the
correspondence between a dataset and a particular distribution, or between two
distributions.
Value
A list of the same form as that returned by qqline
- x
The x coordinates of the points that were/would be plotted, corresponding to a generalised lambda distibution with parameters \(\lambda_1\), \(\lambda_2\), \(\lambda_3\), \(\lambda_4\).
- y
The original
yvector, i.e., the corresponding y coordinates, or a corresponding set of quantiles from a generalised lambda distribution with the second set of parameters
References
King, R.A.R. & MacGillivray, H. L. (1999), A starship method for fitting the generalised \(\lambda\) distributions, Australian and New Zealand Journal of Statistics 41, 353–374