This function puts grobs in a list side-by-side in a single-row gtable from left to right witrh the given widths and height.
gtable_row(
  name,
  grobs,
  height = NULL,
  widths = NULL,
  z = NULL,
  vp = NULL,
  clip = "inherit"
)
Arguments
- name
a string giving the name of the table. This is used to name the layout viewport
- grobs
a single grob or a list of grobs
- height
a unit vector giving the height of this row
- widths
a unit vector giving the width of each column
- z
a numeric vector giving the order in which the grobs should be plotted. Use
Inf(the default) to plot above or-Infbelow all existing grobs. By default positions are on the integers, giving plenty of room to insert new grobs between existing grobs.- vp
a grid viewport object (or NULL).
- clip
should drawing be clipped to the specified cells (
"on"), the entire table ("inherit"), or not at all ("off")
Value
A gtable with a single row and the same number of columns as elements in the grobs list
See also
Other gtable construction:
gtable(),
gtable_col(),
gtable_matrix(),
gtable_spacer
Examples
library(grid)
a <- rectGrob(gp = gpar(fill = "red"))
b <- circleGrob()
c <- linesGrob()
gt <- gtable_row("demo", list(a, b, c))
gt
#> TableGrob (1 x 3) "demo": 3 grobs
#> z cells name grob
#> 1 1 (1-1,1-1) demo rect[GRID.rect.52]
#> 2 2 (1-1,2-2) demo circle[GRID.circle.53]
#> 3 3 (1-1,3-3) demo lines[GRID.lines.54]
plot(gt)
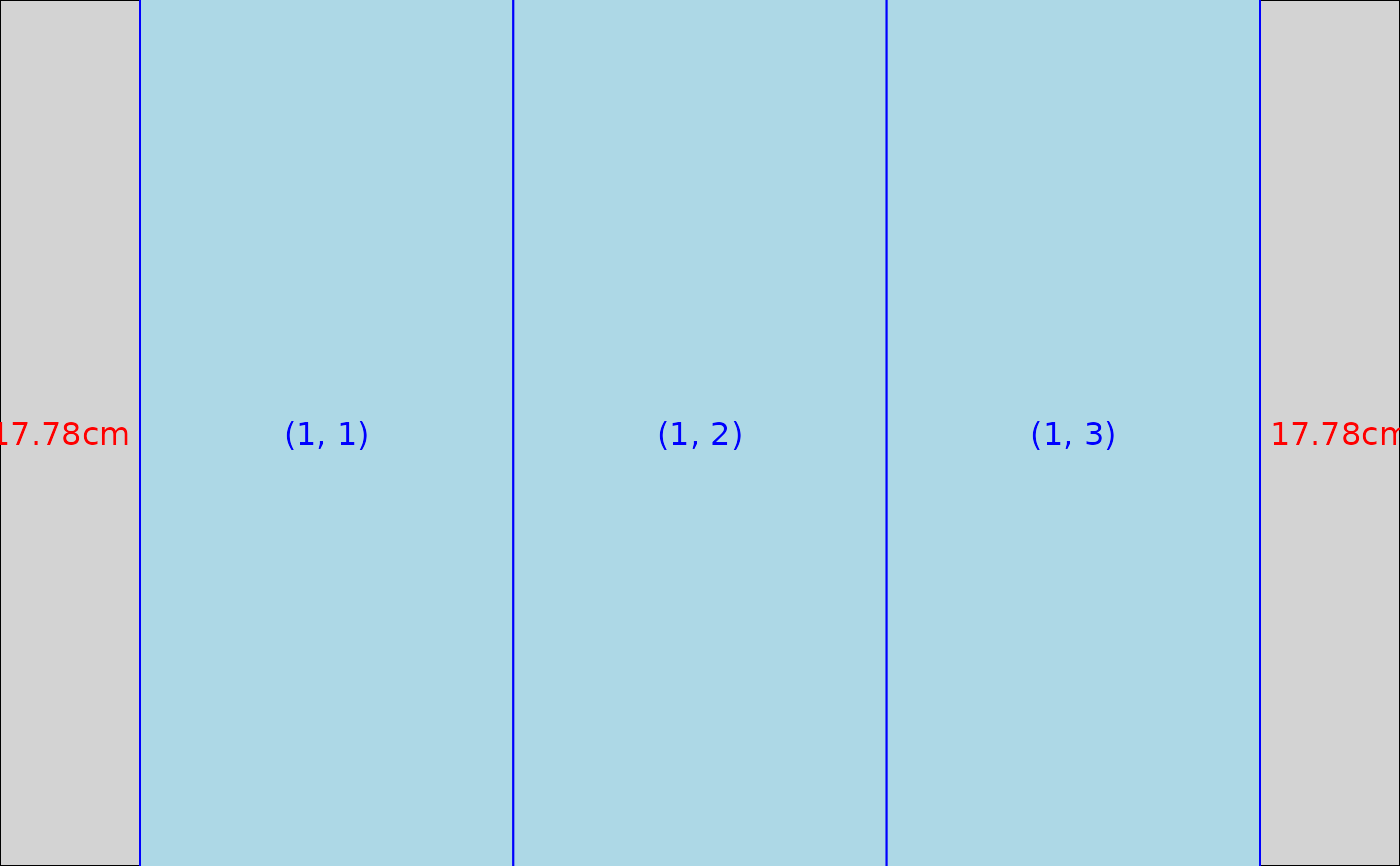
 gtable_show_layout(gt)