Miscellanous panel utilities for three dimensional Trellis Displays
panel.3dmisc.RdMiscellanous panel functions for use with three dimensional Lattice functions such as cloud and wireframe
panel.3dbars(x, y, z,
             rot.mat = diag(4), distance,
             xbase = 1, ybase = 1,
             xlim, xlim.scaled,
             ylim, ylim.scaled,
             zlim, zlim.scaled,
             zero.scaled,
             col = "black",
             lty = 1, lwd = 1,
             alpha,
             ...,
             col.facet = "white",
             alpha.facet = 1)


panel.3dpolygon(x, y, z, rot.mat = diag(4), distance,
                xlim.scaled,
                ylim.scaled,
                zlim.scaled,
                zero.scaled,
                col = "white",
                border = "black",
                font, fontface,
                ...)

panel.3dtext(x, y, z, labels = seq_along(x),
             rot.mat = diag(4), distance, ...)
Arguments
- x, y, z
data to be plotted
- rot.mat, distance
arguments controlling projection
- labels
character or expression vectors to be uses as labels
- xlim, ylim, zlim
limits in the original scale
- xlim.scaled, ylim.scaled, zlim.scaled
limits after scaling
- zero.scaled
the value of z = 0 after scaling
- xbase, ybase
length of the sides of the bars (which are always centered on the
xandyvalues). Can not be vectorized.- col, lty, lwd, alpha, border
Graphical parameters for the border lines. These can be vectors, in which case each component will be associated with one bar in
panel.3dbars.- font, fontface
unused graphical parameters, present in the argument list only so that they can be captured and ignored
- col.facet, alpha.facet
Graphical parameters for surfaces of the bars . These can be vectors, in which case each component will be associated with one bar.
- ...
extra arguments, passed on as appropriate.
Details
panel.3dbars and panel.3dpolygon are both suitable for
use as (components of) the panel.3d.cloud argument of
panel.cloud. The first one produces three dimensional bars,
and the second one draws three dimensional polygons.
See also
Examples
library(lattice)
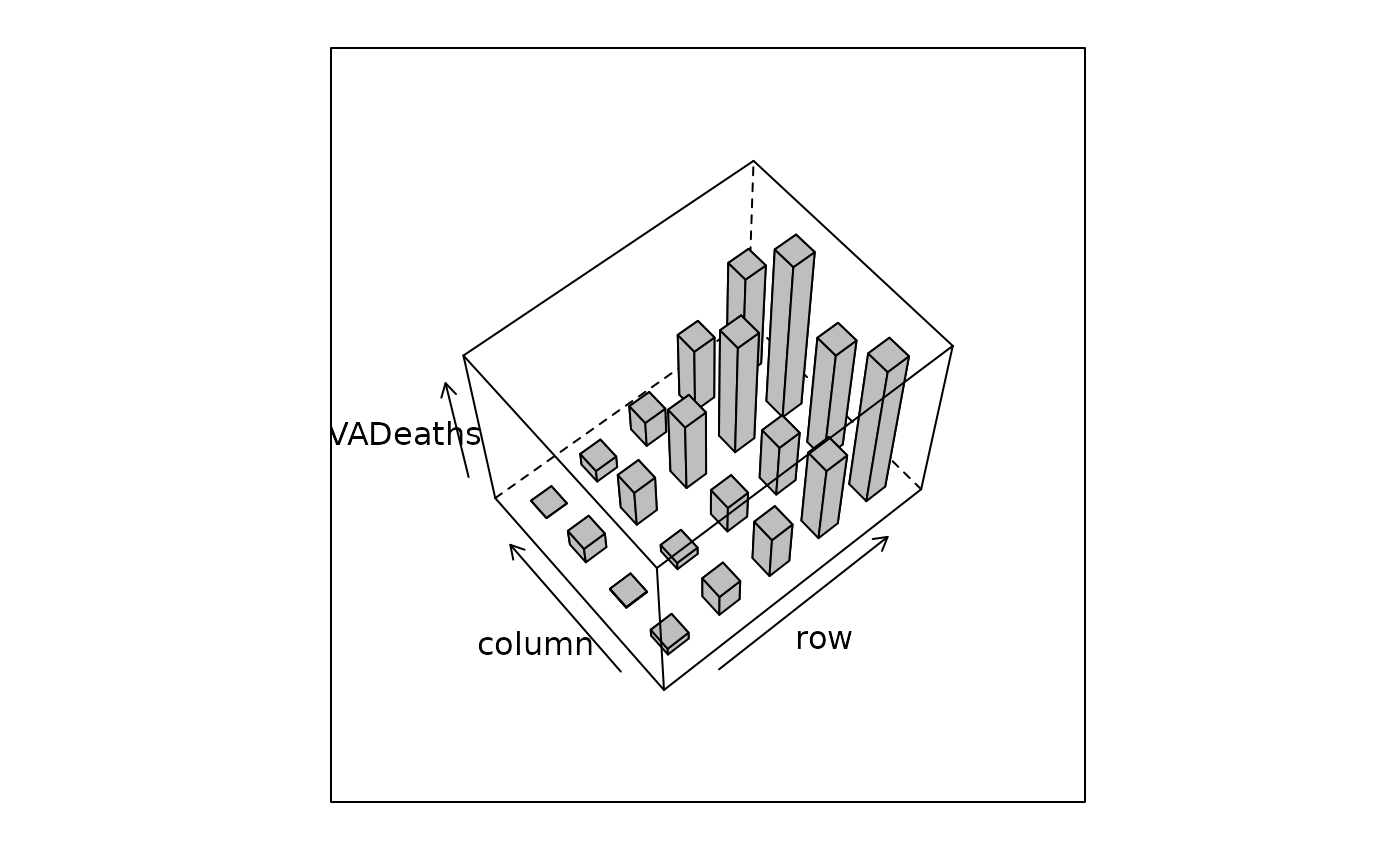
cloud(VADeaths, panel.3d.cloud = panel.3dbars,
col.facet = "grey", xbase = 0.4, ybase = 0.4,
screen = list(z = 40, x = -30))
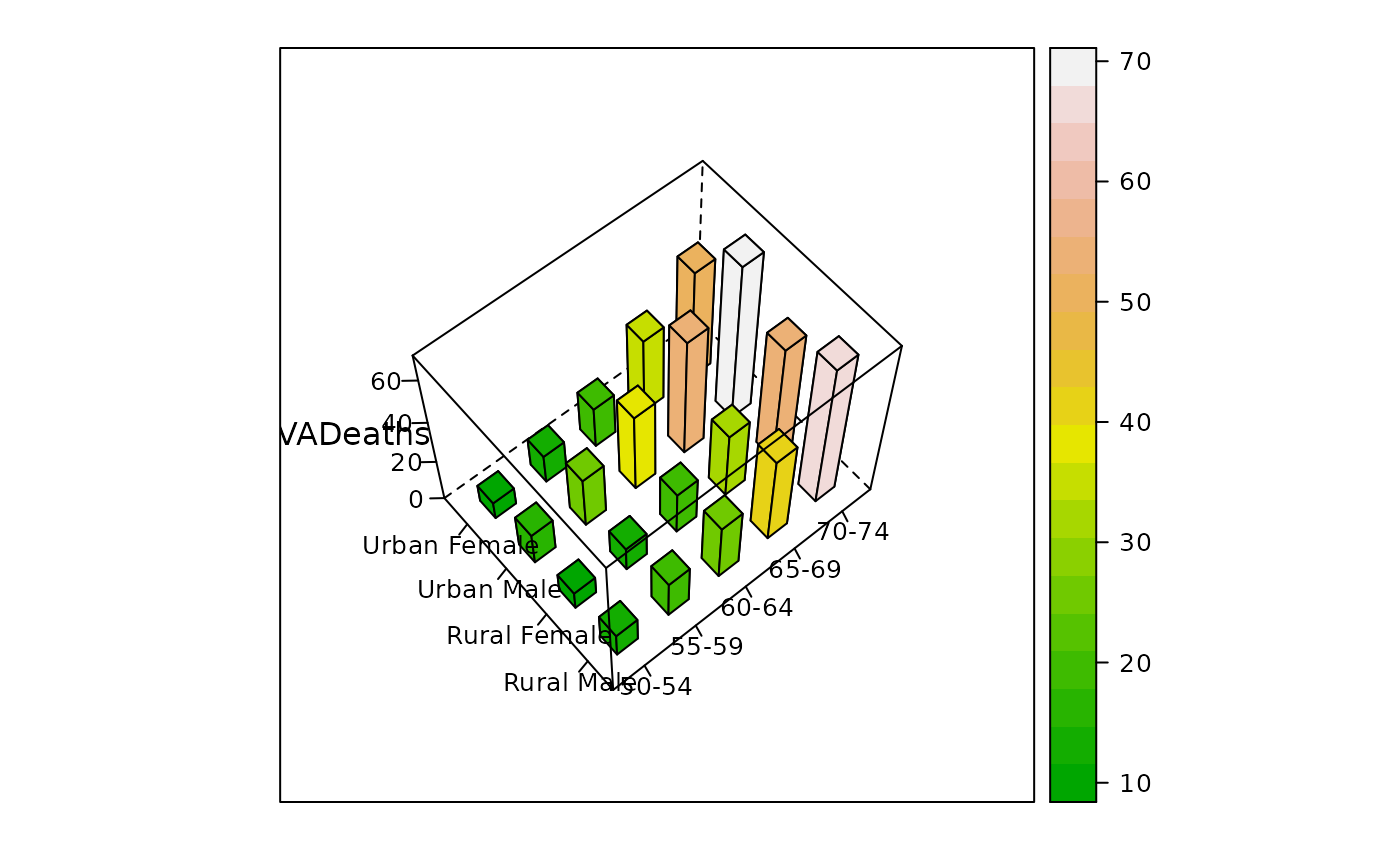
 cloud(VADeaths, panel.3d.cloud = panel.3dbars,
xbase = 0.4, ybase = 0.4, zlim = c(0, max(VADeaths)),
scales = list(arrows = FALSE, just = "right"), xlab = NULL, ylab = NULL,
col.facet = level.colors(VADeaths, at = do.breaks(range(VADeaths), 20),
col.regions = terrain.colors,
colors = TRUE),
colorkey = list(col = terrain.colors, at = do.breaks(range(VADeaths), 20)),
screen = list(z = 40, x = -30))
cloud(VADeaths, panel.3d.cloud = panel.3dbars,
xbase = 0.4, ybase = 0.4, zlim = c(0, max(VADeaths)),
scales = list(arrows = FALSE, just = "right"), xlab = NULL, ylab = NULL,
col.facet = level.colors(VADeaths, at = do.breaks(range(VADeaths), 20),
col.regions = terrain.colors,
colors = TRUE),
colorkey = list(col = terrain.colors, at = do.breaks(range(VADeaths), 20)),
screen = list(z = 40, x = -30))
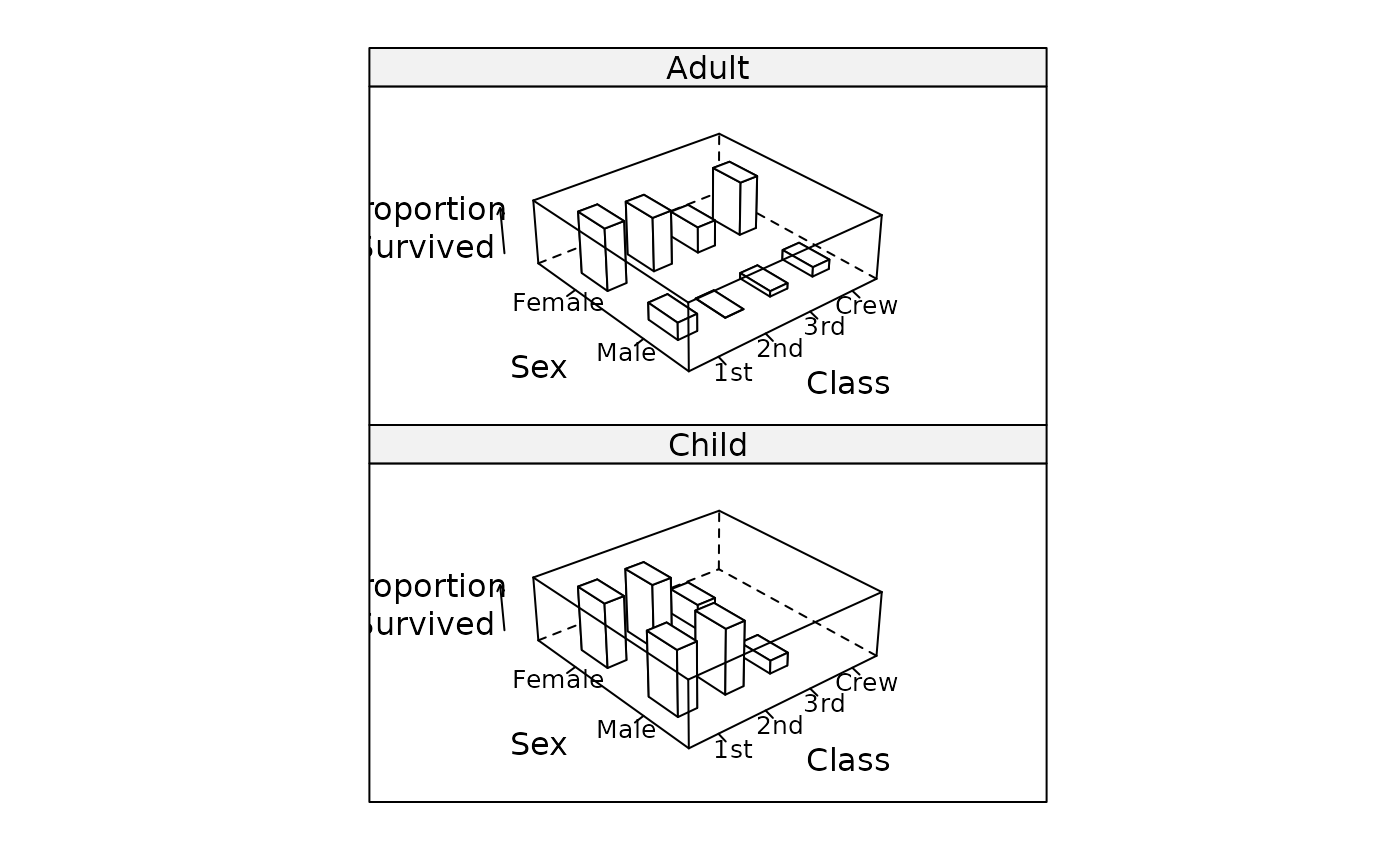
 cloud(as.table(prop.table(Titanic, margin = 1:3)[,,,2]),
type = c("p", "h"),
zlab = "Proportion\nSurvived",
panel.3d.cloud = panel.3dbars,
xbase = 0.4, ybase = 0.4,
aspect = c(1, 0.3),
scales = list(distance = 2),
panel.aspect = 0.5)
cloud(as.table(prop.table(Titanic, margin = 1:3)[,,,2]),
type = c("p", "h"),
zlab = "Proportion\nSurvived",
panel.3d.cloud = panel.3dbars,
xbase = 0.4, ybase = 0.4,
aspect = c(1, 0.3),
scales = list(distance = 2),
panel.aspect = 0.5)