Lattice panel function to fit and draw a confidence ellipsoid from bivariate data.
panel.ellipse.RdA lattice panel function that computes and draws a confidence ellipsoid from bivariate data, possibly grouped by a third variable.
panel.ellipse(x, y, groups = NULL,
              level = 0.68, segments = 50, robust = FALSE,
              center.pch = 3, center.cex = 2, ...,
              type, pch, cex)
Arguments
- x, y
Numeric vectors of same length giving the bivariate data. Non-numeric variables will be coerced to be numeric.
- groups
Optional grouping variable.
- level
Confidence level for the ellipse.
- segments
Number of segments used to approximate the ellipse.
- robust
Logical indicating whether a robust method should be used. If
TRUE, the confidence ellipse is based on a bivariate t-distribution using thecov.trobfunction in the MASS package.- center.pch
Plotting character for the center (fitted mean). If
NULL, the center will not be shown on the plot.- center.cex
Character expansion (size) multipler for the symbol indicating the center.
- ...
Further arguments, typically graphical parameters. Passed on to
panel.xyplot.- type, pch, cex
Parameters that are ignored; these are present only to make sure they are not inadvertently passed on to
panel.xyplot.
Examples
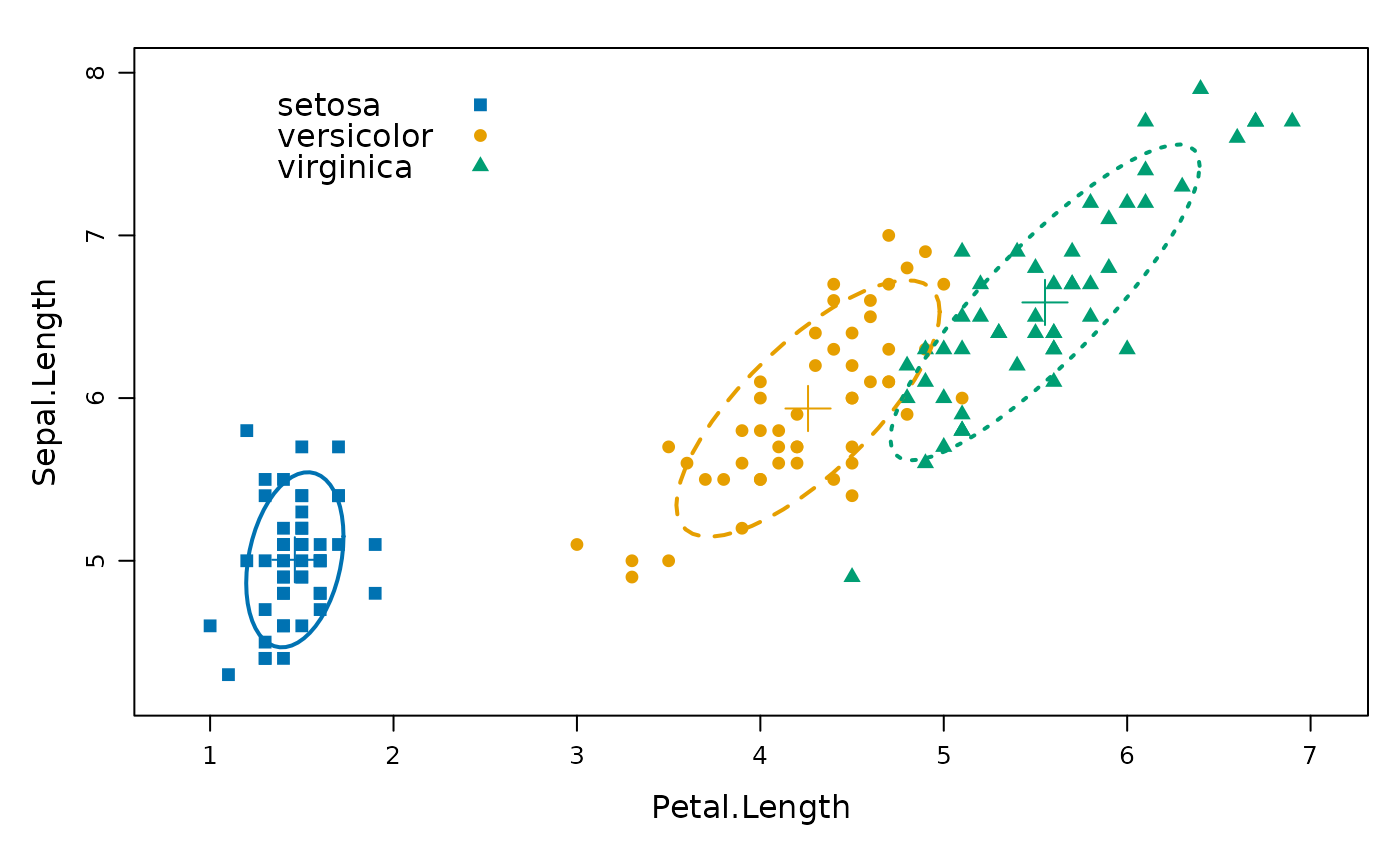
xyplot(Sepal.Length ~ Petal.Length, groups=Species,
data = iris, scales = "free",
par.settings = list(superpose.symbol = list(pch=c(15:17)),
superpose.line = list(lwd=2, lty=1:3)),
panel = function(x, y, ...) {
panel.xyplot(x, y, ...)
panel.ellipse(x, y, ...)
},
auto.key = list(x = .1, y = .8, corner = c(0, 0)))
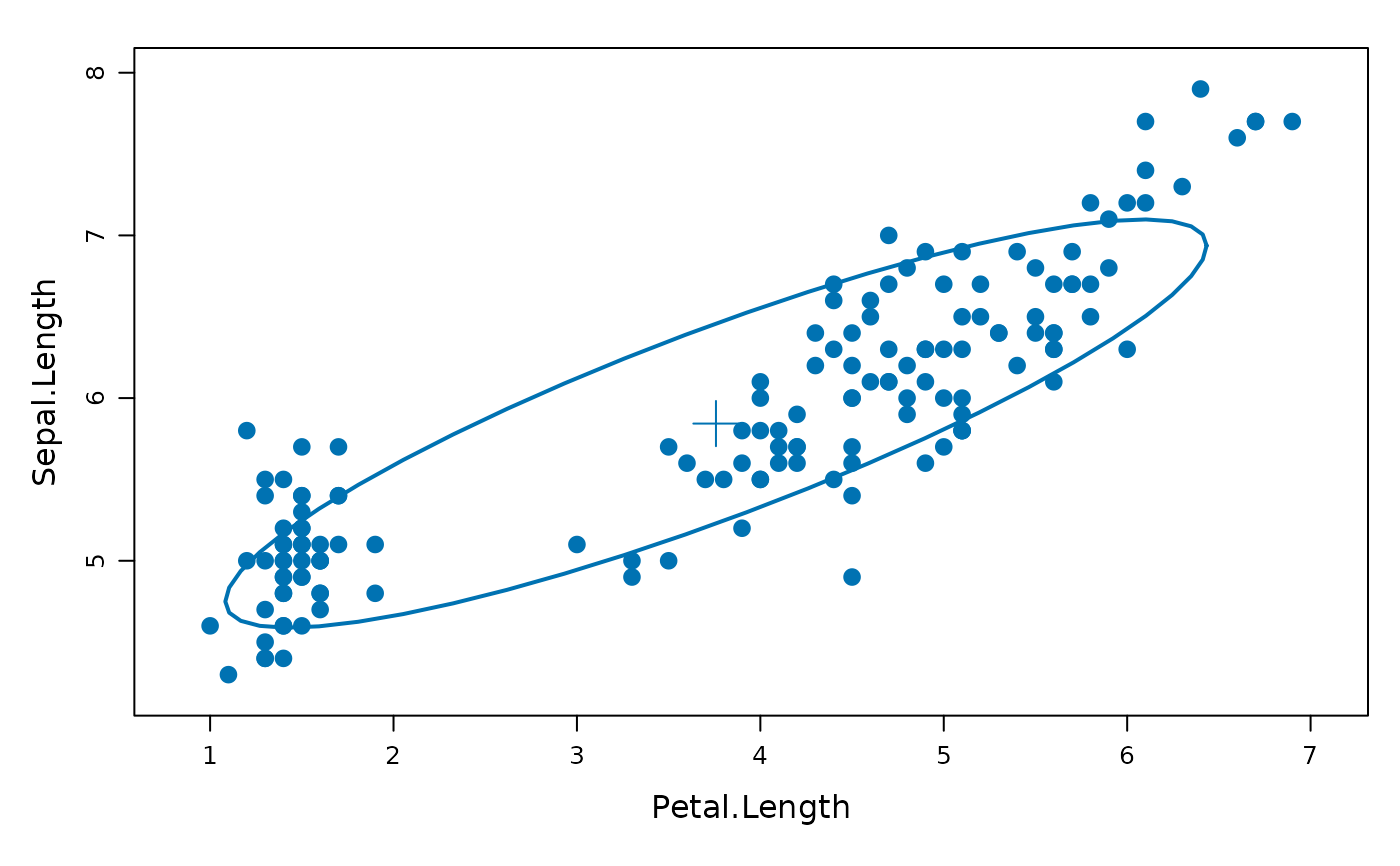
 ## Without groups
xyplot(Sepal.Length ~ Petal.Length,
data = iris, scales = "free",
par.settings = list(plot.symbol = list(cex = 1.1, pch=16)),
panel = function(x, y, ...) {
panel.xyplot(x, y, ...)
panel.ellipse(x, y, lwd = 2, ...)
},
auto.key = list(x = .1, y = .8, corner = c(0, 0)))
## Without groups
xyplot(Sepal.Length ~ Petal.Length,
data = iris, scales = "free",
par.settings = list(plot.symbol = list(cex = 1.1, pch=16)),
panel = function(x, y, ...) {
panel.xyplot(x, y, ...)
panel.ellipse(x, y, lwd = 2, ...)
},
auto.key = list(x = .1, y = .8, corner = c(0, 0)))
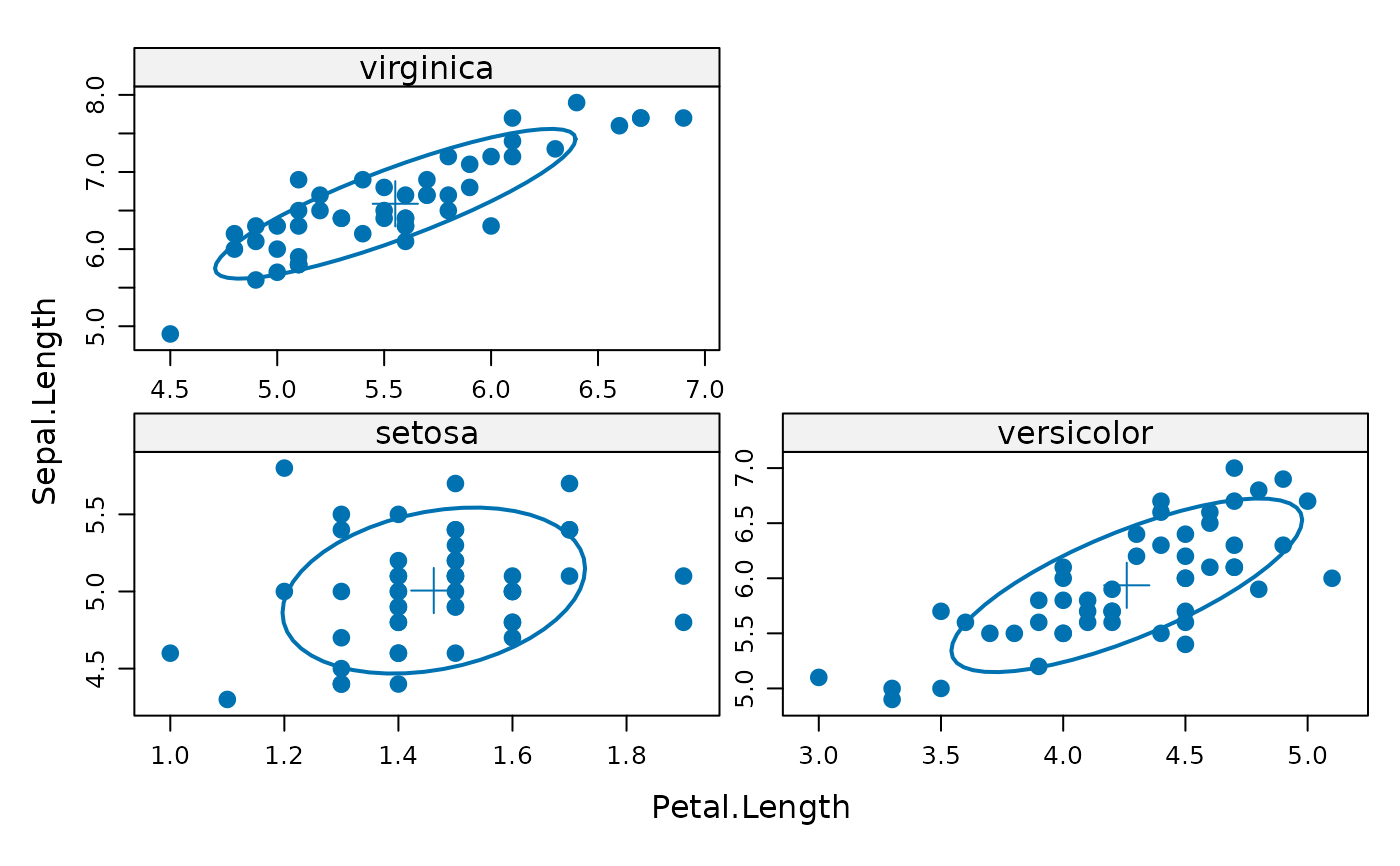
 ## With conditioning
xyplot(Sepal.Length ~ Petal.Length | Species,
data = iris, scales = "free",
par.settings = list(plot.symbol = list(cex = 1.1, pch=16)),
layout=c(2,2),
panel = function(x, y, ...) {
panel.xyplot(x, y, ...)
panel.ellipse(x, y, lwd = 2, ...)
},
auto.key = list(x = .6, y = .8, corner = c(0, 0)))
## With conditioning
xyplot(Sepal.Length ~ Petal.Length | Species,
data = iris, scales = "free",
par.settings = list(plot.symbol = list(cex = 1.1, pch=16)),
layout=c(2,2),
panel = function(x, y, ...) {
panel.xyplot(x, y, ...)
panel.ellipse(x, y, lwd = 2, ...)
},
auto.key = list(x = .6, y = .8, corner = c(0, 0)))
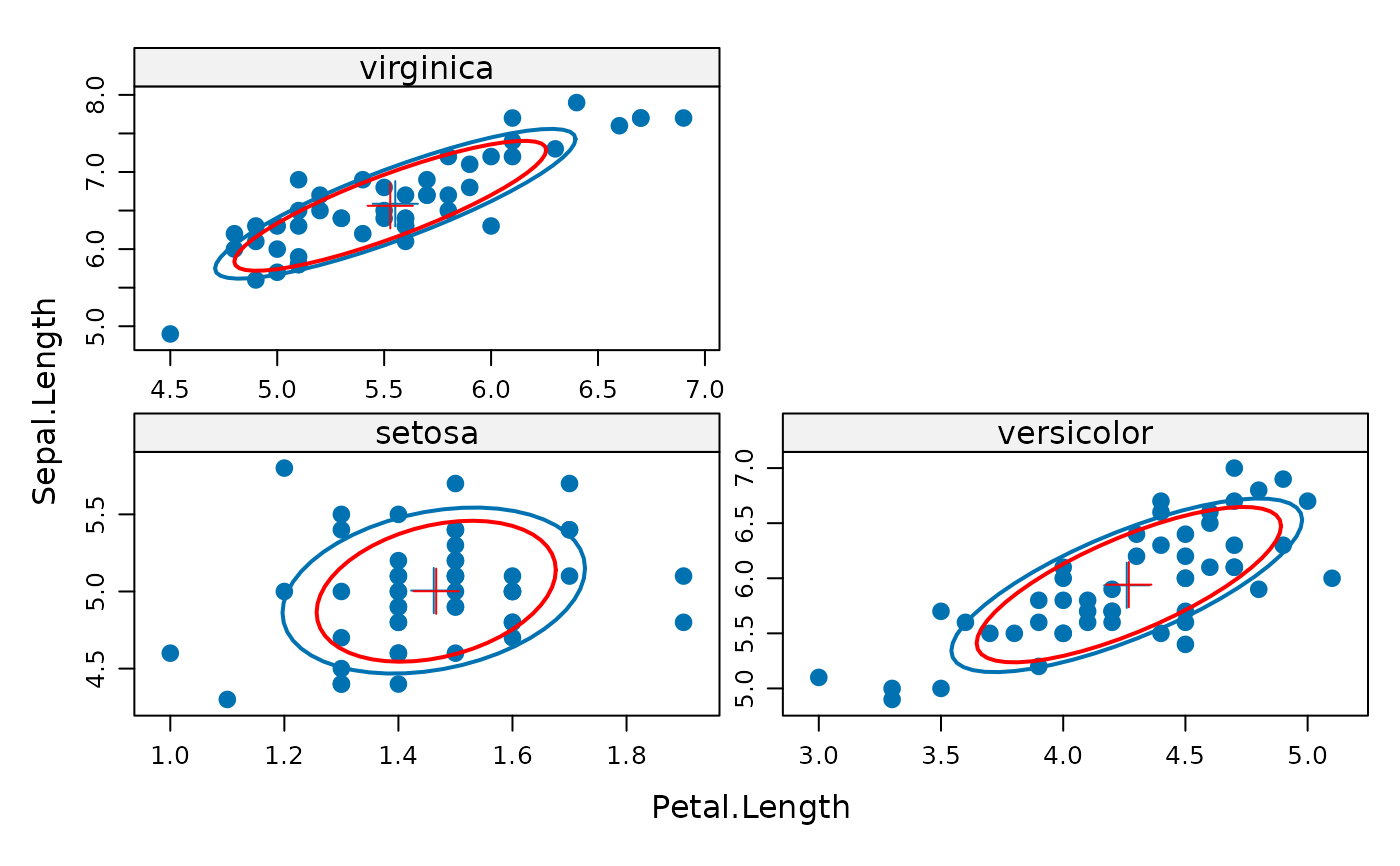
 ## Compare classical with robust
xyplot(Sepal.Length ~ Petal.Length | Species,
data = iris, scales = "free",
par.settings = list(plot.symbol = list(cex = 1.1, pch=16)),
layout=c(2,2),
panel = function(x, y, ...) {
panel.xyplot(x, y, ...)
panel.ellipse(x, y, lwd = 2, ...)
panel.ellipse(x, y, lwd = 2, col="red", robust=TRUE, ...)
})
## Compare classical with robust
xyplot(Sepal.Length ~ Petal.Length | Species,
data = iris, scales = "free",
par.settings = list(plot.symbol = list(cex = 1.1, pch=16)),
layout=c(2,2),
panel = function(x, y, ...) {
panel.xyplot(x, y, ...)
panel.ellipse(x, y, lwd = 2, ...)
panel.ellipse(x, y, lwd = 2, col="red", robust=TRUE, ...)
})