Plot series as filled polygons.
panel.xyarea.RdPlot series as filled polygons connected at given origin level (on y axis).
panel.xyarea(x, ...)

# Default S3 method
panel.xyarea(x, y, groups = NULL, origin = NULL, horizontal = FALSE,
             col, col.line, border, lty, lwd, alpha, ...,
             fill, panel.groups = panel.xyarea)

# S3 method for class 'ts'
panel.xyarea(x, y = x, ...)
# S3 method for class 'zoo'
panel.xyarea(x, y = x, ...)

panel.qqmath.xyarea(x, y = NULL, f.value = NULL, distribution = qnorm,
                    qtype = 7, groups = NULL, ..., tails.n = 0)
Arguments
- x, y
data vectors.
- groups
a factor defining groups.
- origin
level on y axis to connect the start and end of the series. If
NULL, the polygon is filled to the bottom of the panel. It is flipped ifhorizontal = TRUE.- horizontal
if this is set to
TRUE, then the origin is a level on the x axis, rather than the default which is on the y axis. This is the opposite of what you might expect, but is for consistency withpanel.xyplot.- col, col.line, border, lty, lwd, alpha
graphical parameters taken from
trellis.par.get("plot.polygon")ortrellis.par.get("superpose.polygon")(when groups defined).col.lineoverridescol.- ...
further arguments passed on to
panel.polygon. Forpanel.qqmath.xyarea, passed topanel.xyarea.- fill
ignored; use
colinstead.- panel.groups
used in
panel.superpose.- f.value, distribution, qtype, tails.n
as in
panel.qqmath.
Details
none yet.
See also
Examples
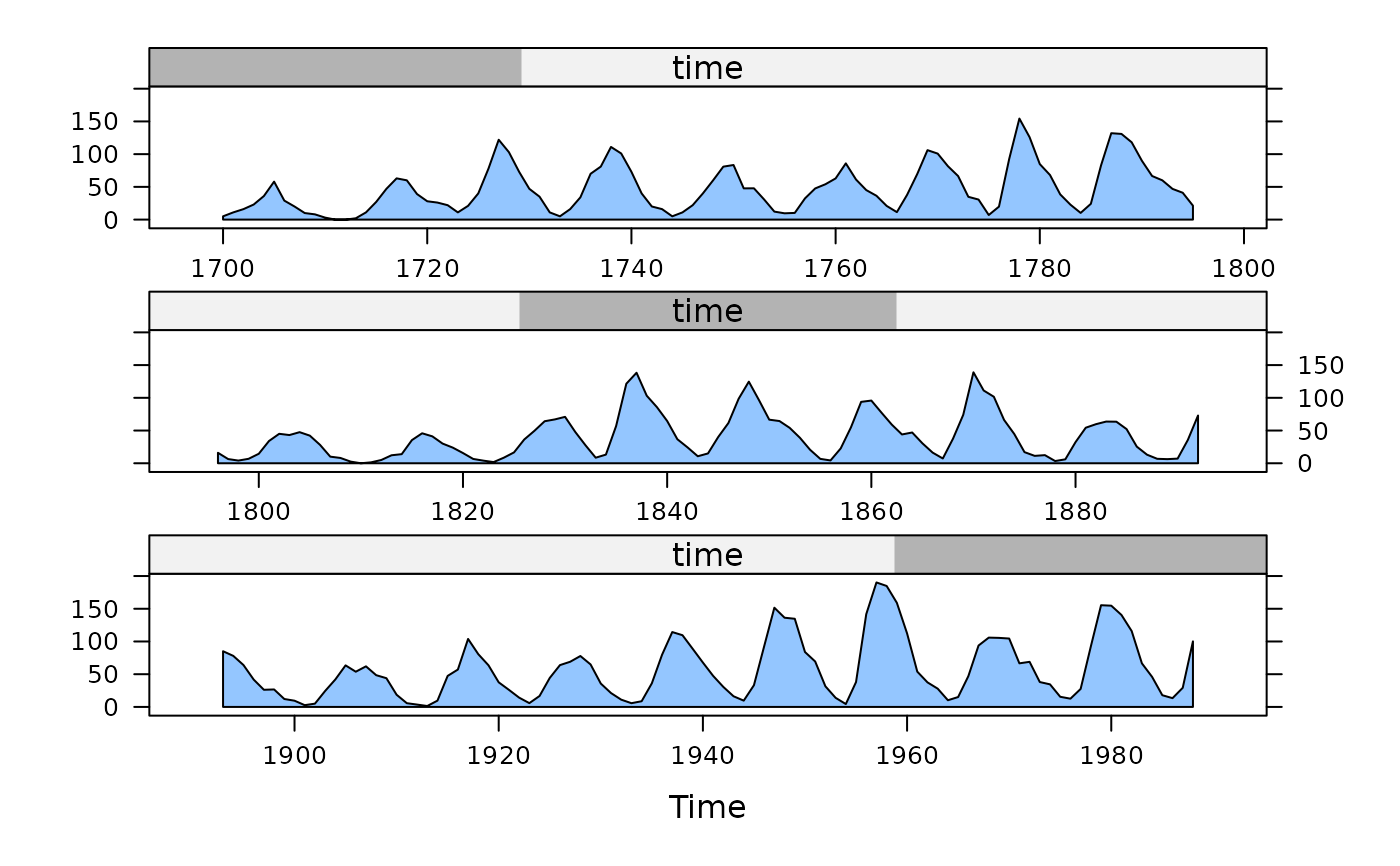
xyplot(sunspot.year, panel = panel.xyarea, origin = 0,
aspect = "xy", cut = list(n = 3, overlap = 0))
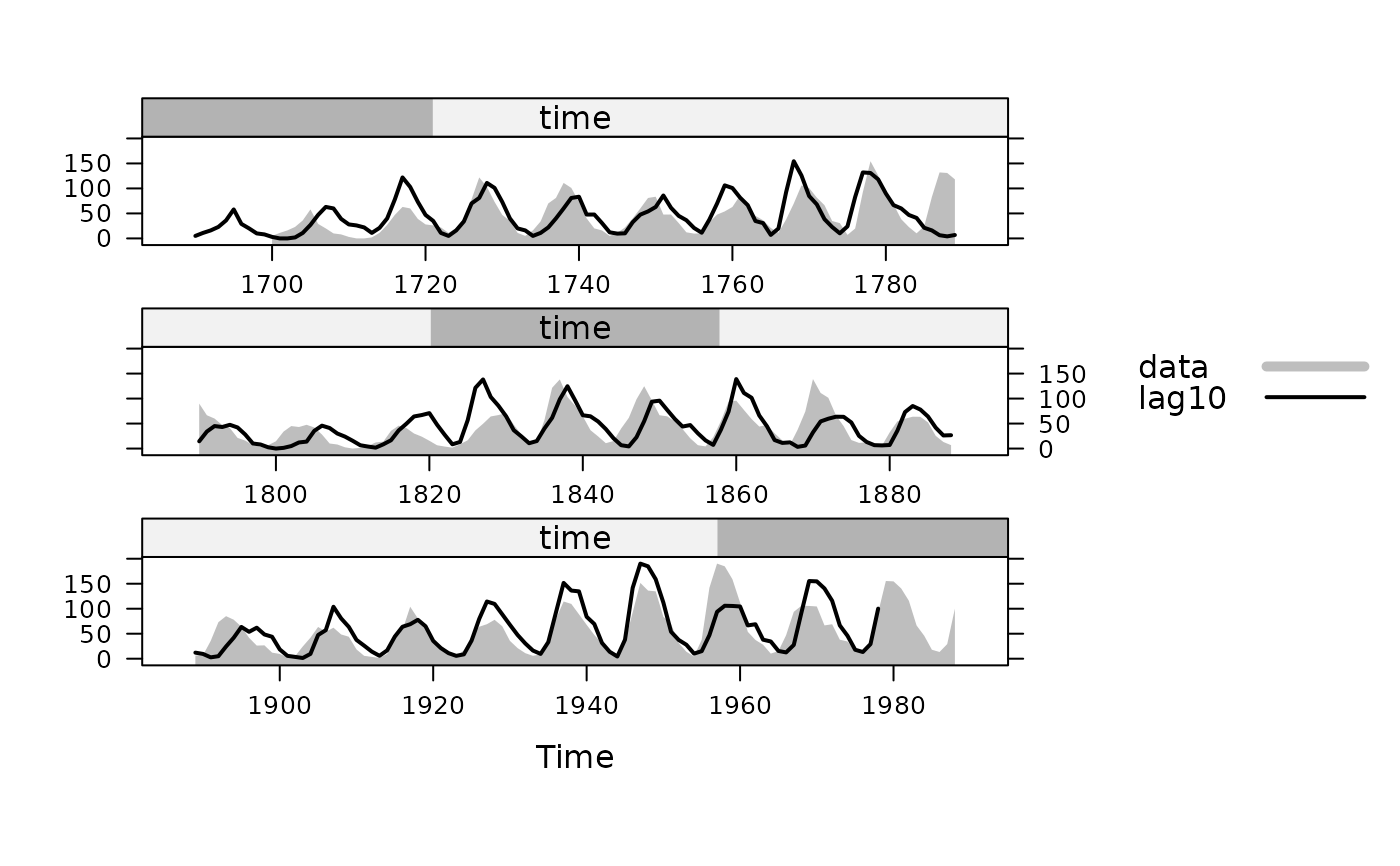
 ## two series superposed: one filled, one as a line.
xyplot(ts.union(data = sunspot.year, lag10 = lag(sunspot.year, 10)),
aspect = "xy", cut = list(n = 3, overlap = 0),
superpose = TRUE,
panel = panel.superpose,
panel.groups = function(..., group.number) {
if (group.number == 1)
panel.xyarea(...) else panel.xyplot(...)
}, border = NA,
par.settings = simpleTheme(col = c("grey", "black"), lwd = c(5,2)))
## two series superposed: one filled, one as a line.
xyplot(ts.union(data = sunspot.year, lag10 = lag(sunspot.year, 10)),
aspect = "xy", cut = list(n = 3, overlap = 0),
superpose = TRUE,
panel = panel.superpose,
panel.groups = function(..., group.number) {
if (group.number == 1)
panel.xyarea(...) else panel.xyplot(...)
}, border = NA,
par.settings = simpleTheme(col = c("grey", "black"), lwd = c(5,2)))
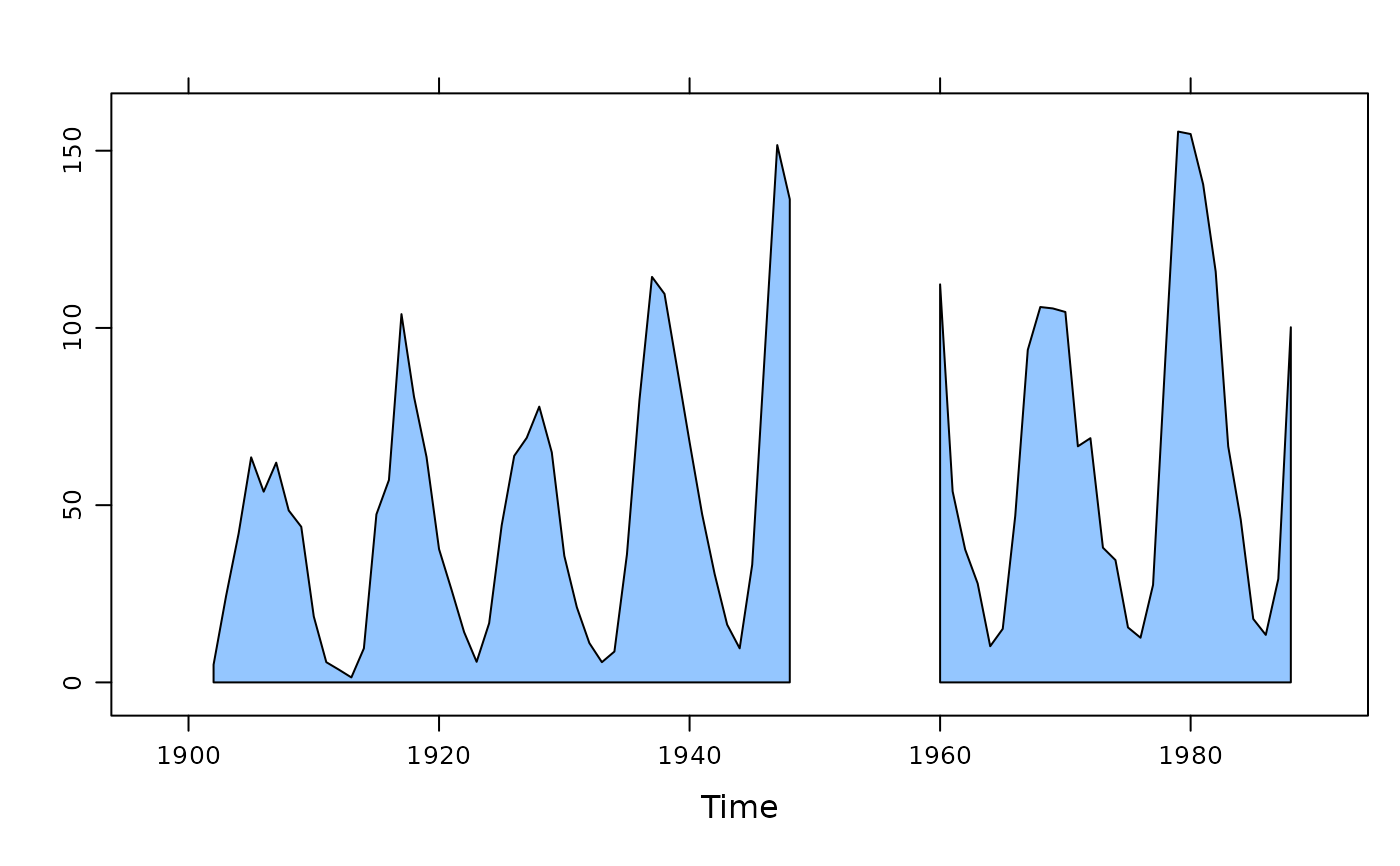
 ## missing values are handled by splitting the series
tmp <- window(sunspot.year, start = 1900)
tmp[c(1:2, 50:60)] <- NA
xyplot(tmp, panel = panel.xyarea, origin = 0)
## missing values are handled by splitting the series
tmp <- window(sunspot.year, start = 1900)
tmp[c(1:2, 50:60)] <- NA
xyplot(tmp, panel = panel.xyarea, origin = 0)
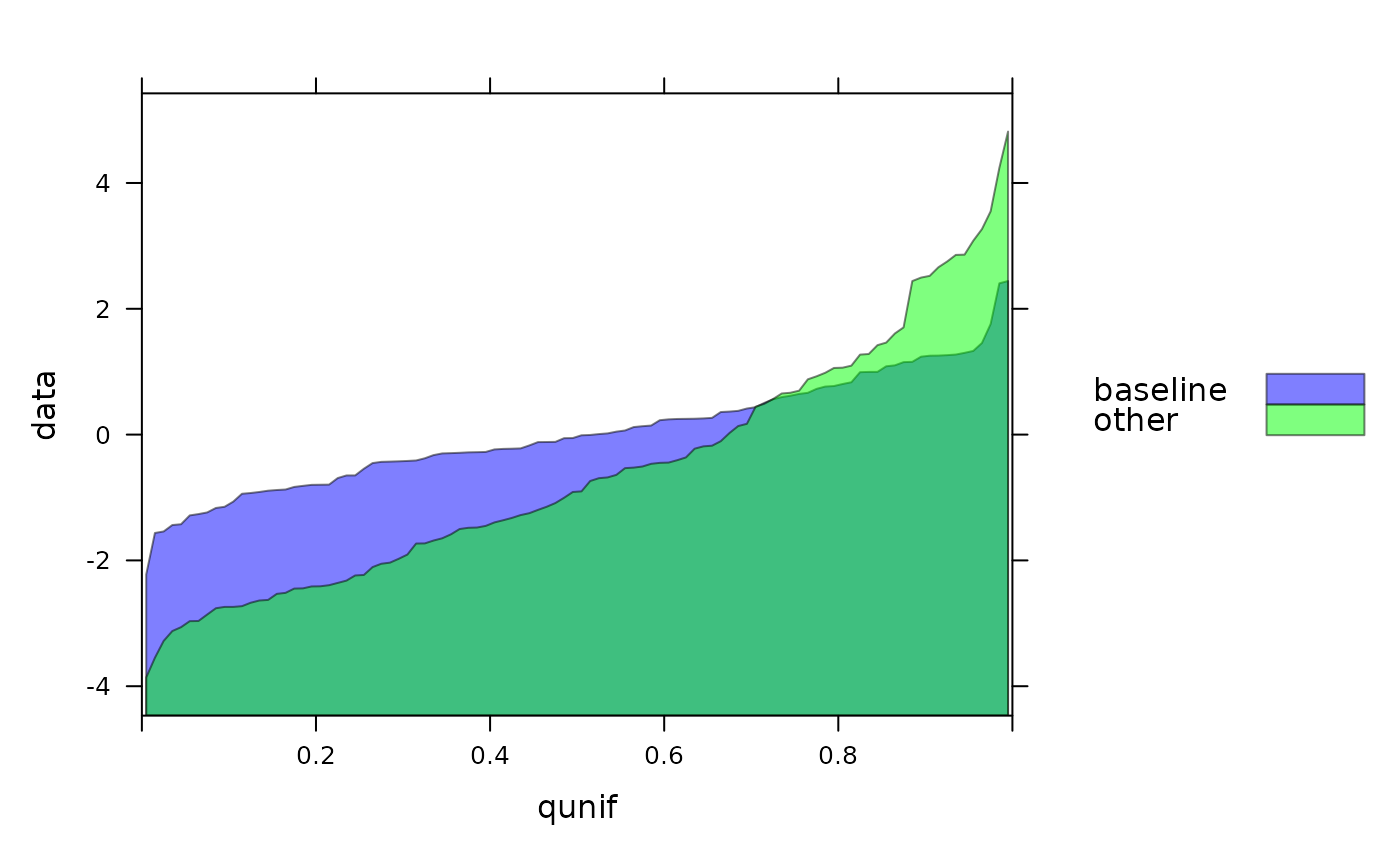
 set.seed(0)
qqmath(~ data, make.groups(baseline = rnorm(100),
other = rnorm(100) * 2 - 0.5),
groups = which, distribution = qunif,
panel = panel.qqmath.xyarea, xlim = 0:1,
auto.key = list(points = FALSE, rectangles = TRUE),
par.settings = simpleTheme(col = c("blue", "green"),
alpha = 0.5))
set.seed(0)
qqmath(~ data, make.groups(baseline = rnorm(100),
other = rnorm(100) * 2 - 0.5),
groups = which, distribution = qunif,
panel = panel.qqmath.xyarea, xlim = 0:1,
auto.key = list(points = FALSE, rectangles = TRUE),
par.settings = simpleTheme(col = c("blue", "green"),
alpha = 0.5))