Custom lattice axis scales
scale.components.RdConvenience functions for drawing axes with various non-default tick positions and labels.
xscale.components.logpower(lim, ...)
yscale.components.logpower(lim, ...)

xscale.components.fractions(lim, logsc = FALSE, ...)
yscale.components.fractions(lim, logsc = FALSE, ...)

xscale.components.log10ticks(lim, logsc = FALSE, at = NULL, ...)
yscale.components.log10ticks(lim, logsc = FALSE, at = NULL, ...)

xscale.components.log(lim, logsc = FALSE, at = NULL, loc = NULL, ...)
yscale.components.log(lim, logsc = FALSE, at = NULL, loc = NULL, ...)

xscale.components.log10.3(lim, logsc = FALSE, at = NULL, ...)
yscale.components.log10.3(lim, logsc = FALSE, at = NULL, ...)

xscale.components.subticks(lim, ..., n = 5, n2 = n * 5, min.n2 = n + 5)
yscale.components.subticks(lim, ..., n = 5, n2 = n * 5, min.n2 = n + 5)
Arguments
- lim
scale limits.
- ...
passed on to
xscale.components.defaultoryscale.components.default.- logsc
logbase, typically specified in thescalesargument to a high-level lattice plot.- at
this is ignored unless it is
NULL, in which case nothing is drawn.- loc
Ignored if
NULL. Otherwise, vector of values between 1 and 9 that form the template for tick mark locations after being scaled appropriately. For example,loc = c(1, 3)leads to tick marks atc(0.1, 0.3, 1, 3, 10, 30)and so on.- n
desired number of intervals between major axis ticks (passed to
pretty.- n2, min.n2
desired, and minimum, number of intervals between minor axis ticks (passed to
pretty.
Details
These functions are intended to be passed to the
xscale.components or yscale.components arguments of
high-level lattice plots. See xscale.components.default.
xscale.components.logpower draws tickmarks at the same
locations as the default, but labels them more smartly using
superscripts for the power (using expressions).
xscale.components.fractions labels the tickmarks as fractions.
xscale.components.log10ticks puts major tick marks at powers of
10, and minor tickmarks in between.
References
Sarkar, Deepayan (2008) “Lattice: Multivariate Data Visualization with R”, Springer. ISBN: 978-0-387-75968-5 http://lmdvr.r-forge.r-project.org/figures/figures.html?chapter=08;figure=08_04
Examples
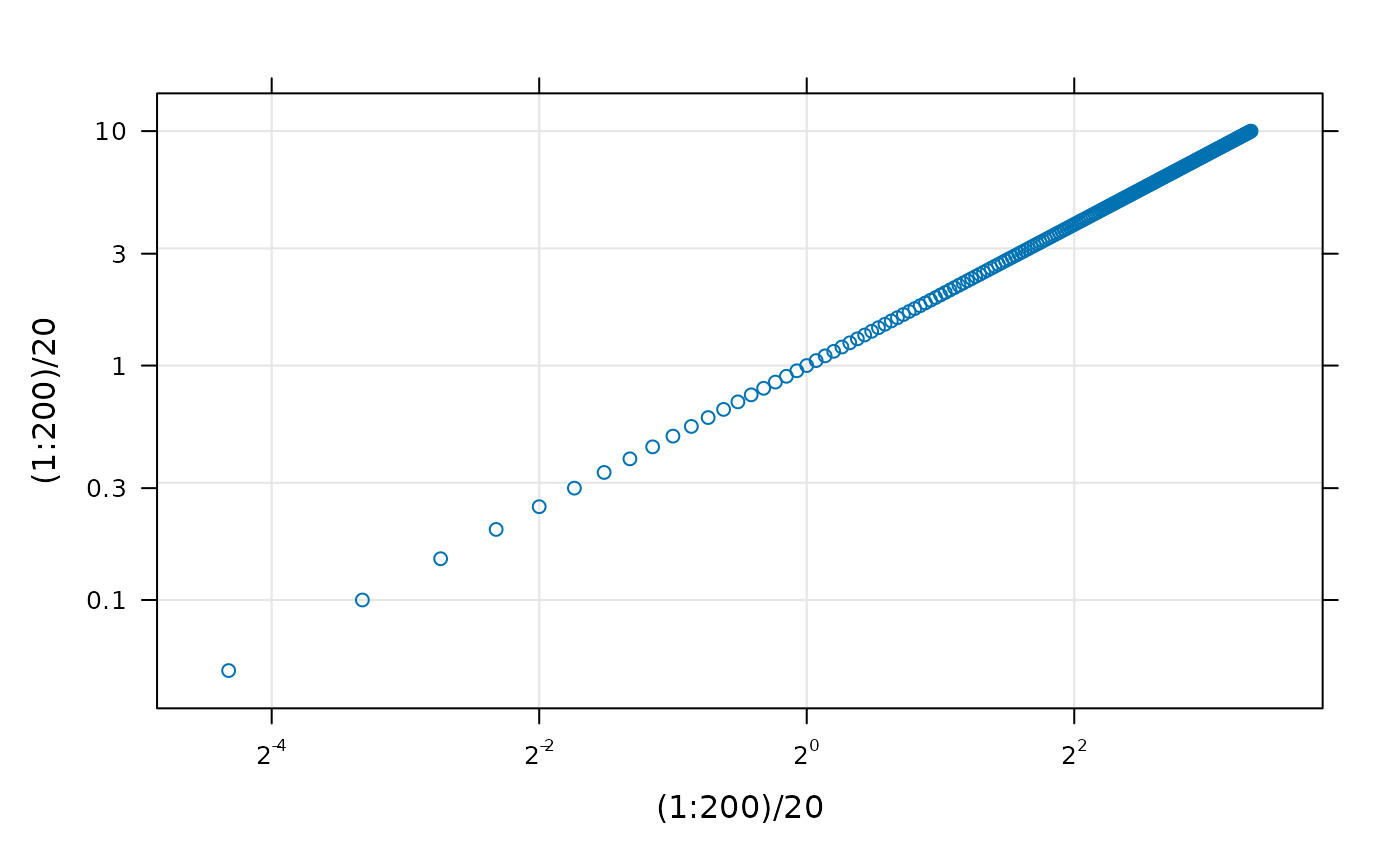
xyplot((1:200)/20 ~ (1:200)/20, type = c("p", "g"),
scales = list(x = list(log = 2), y = list(log = 10)),
xscale.components = xscale.components.fractions,
yscale.components = yscale.components.log10ticks)
 xyplot((1:200)/20 ~ (1:200)/20, type = c("p", "g"),
scales = list(x = list(log = 2), y = list(log = 10)),
xscale.components = xscale.components.logpower,
yscale.components = yscale.components.log10.3)
xyplot((1:200)/20 ~ (1:200)/20, type = c("p", "g"),
scales = list(x = list(log = 2), y = list(log = 10)),
xscale.components = xscale.components.logpower,
yscale.components = yscale.components.log10.3)
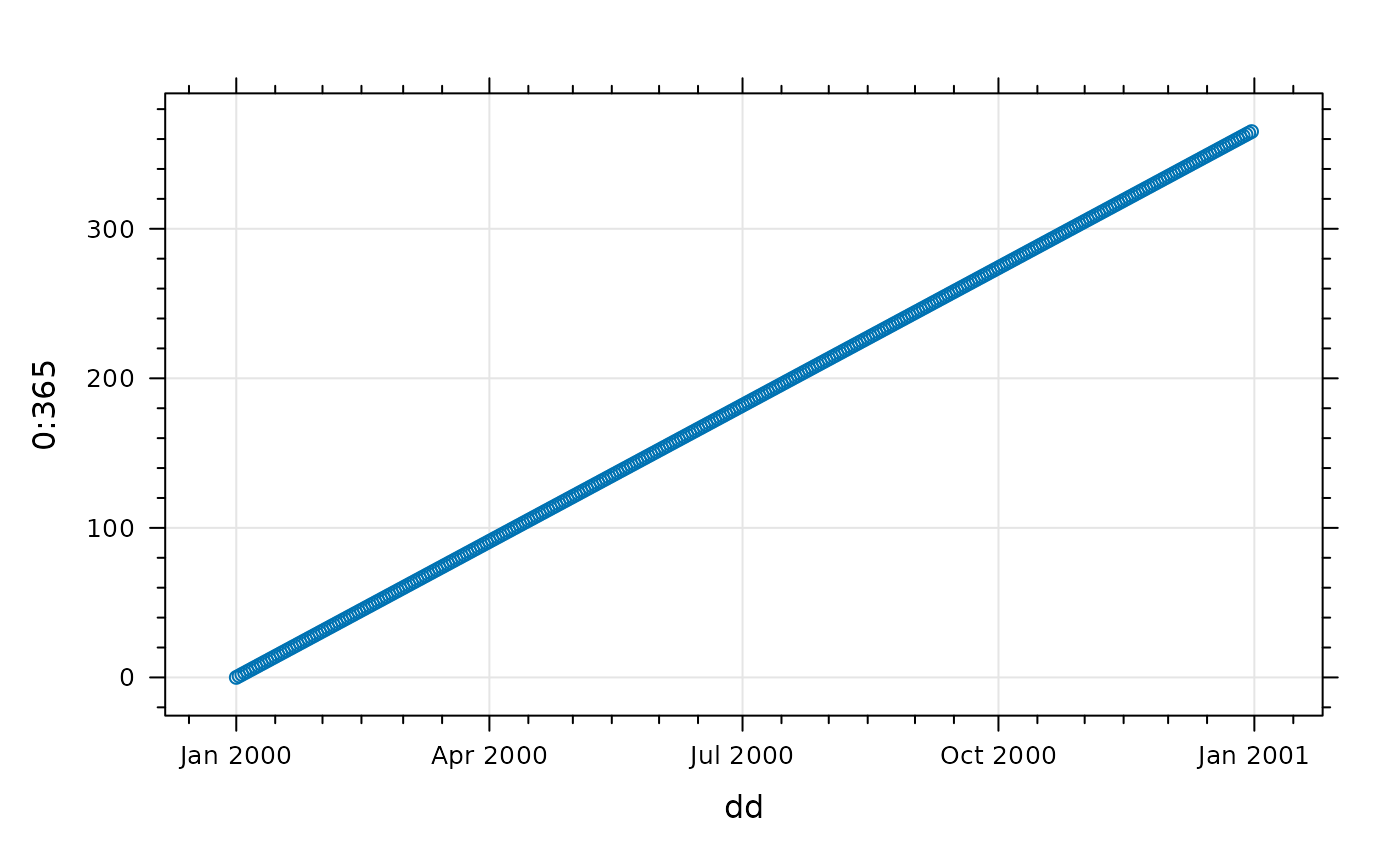
 dd <- as.Date("2000-01-01") + 0:365
xyplot(0:365 ~ dd, type = c("p", "g"),
xscale.components = xscale.components.subticks,
yscale.components = yscale.components.subticks)
dd <- as.Date("2000-01-01") + 0:365
xyplot(0:365 ~ dd, type = c("p", "g"),
xscale.components = xscale.components.subticks,
yscale.components = yscale.components.subticks)