Plot a spatial mosaic from irregular 2D points
tileplot.RdRepresents an irregular set of (x, y) points with a color covariate. Polygons are drawn enclosing the area closest to each point. This is known variously as a Voronoi mosaic, a Dirichlet tesselation, or Thiessen polygons.
tileplot(x, data = NULL, aspect = "iso",
         prepanel = "prepanel.default.xyplot",
         panel = "panel.voronoi", ...)
Arguments
- x, data
formula and data as in
levelplot, except that it expects irregularly spaced points rather than a regular grid.- aspect
aspect ratio: "iso" is recommended as it reproduces the distances used in the triangulation calculations.
- panel, prepanel
see
xyplot.- ...
further arguments to the panel function, which defaults to
panel.voronoi.
Details
See panel.voronoi for further options and details.
See also
Examples
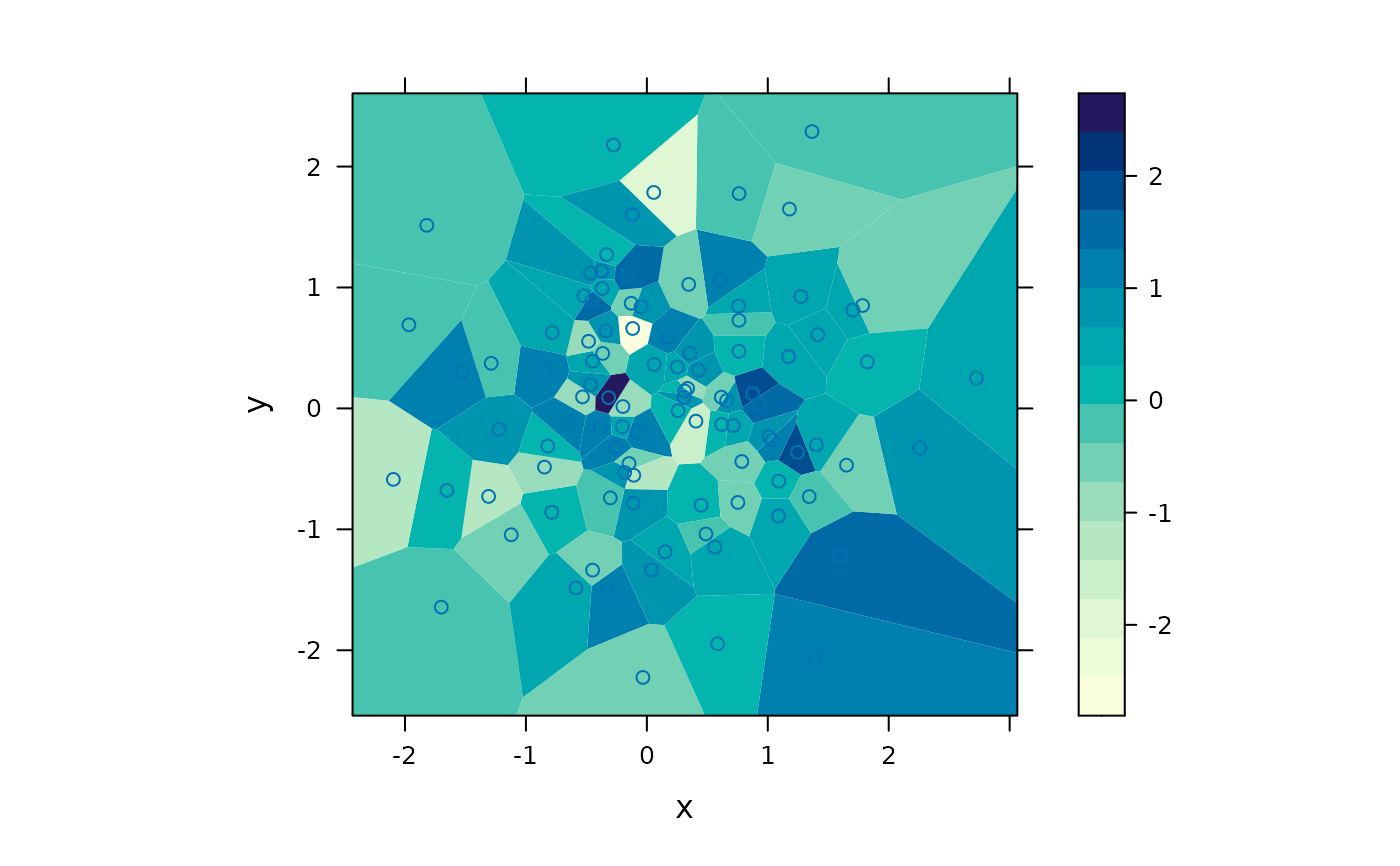
xyz <- data.frame(x = rnorm(100), y = rnorm(100), z = rnorm(100))
tileplot(z ~ x * y, xyz)
 ## Alternative backend using 'deldir' package
if (FALSE) { # \dontrun{
tileplot(z ~ x * y, xyz, backend = "deldir")
} # }
## showing rectangular window boundary
tileplot(z ~ x * y, xyz, xlim = c(-2, 4), ylim = c(-2, 4))
## Alternative backend using 'deldir' package
if (FALSE) { # \dontrun{
tileplot(z ~ x * y, xyz, backend = "deldir")
} # }
## showing rectangular window boundary
tileplot(z ~ x * y, xyz, xlim = c(-2, 4), ylim = c(-2, 4))
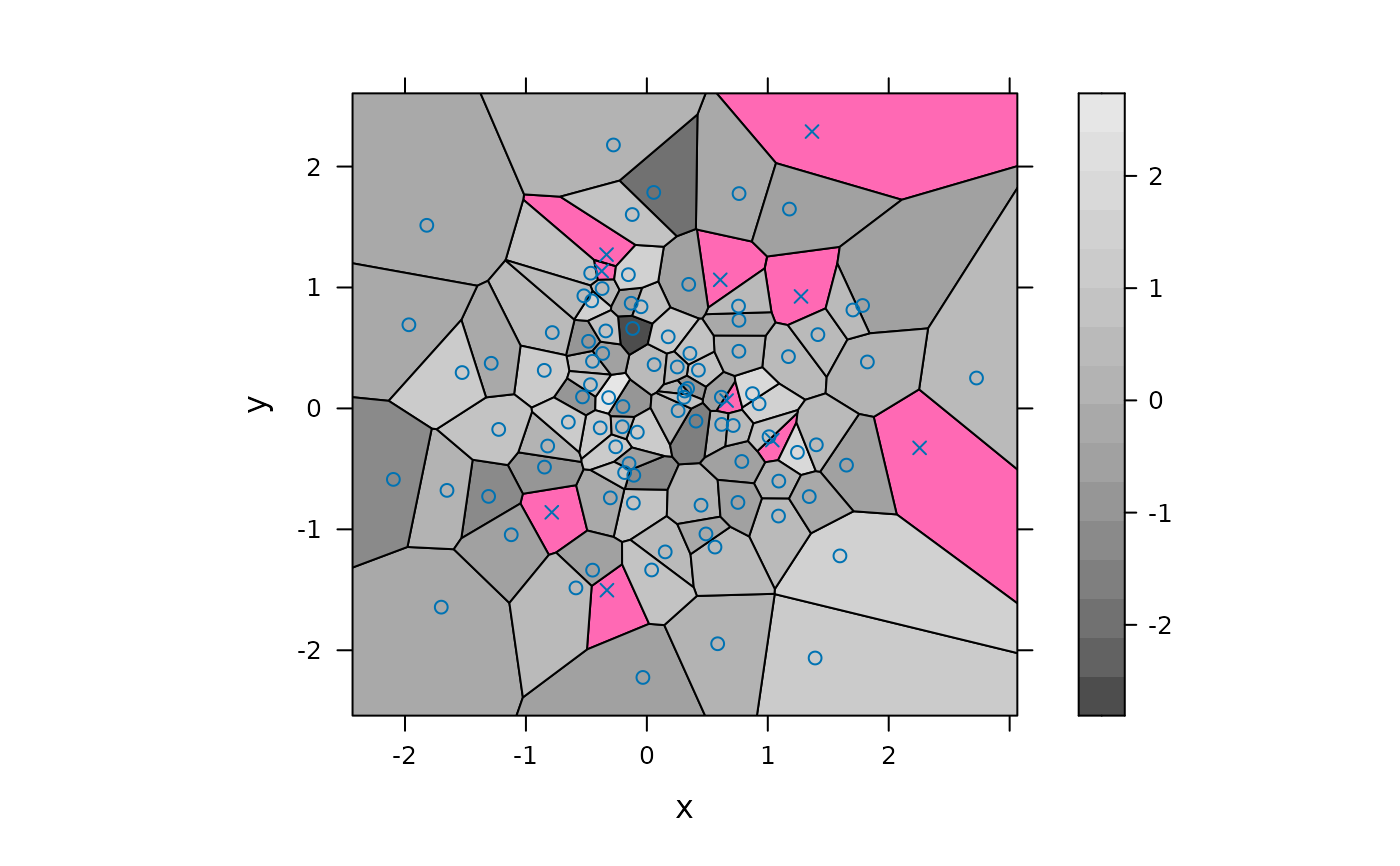
 ## insert some missing values
xyz$z[1:10] <- NA
## the default na.rm = FALSE shows missing polygons
tileplot(z ~ x * y, xyz, border = "black",
col.regions = grey.colors(100),
pch = ifelse(is.na(xyz$z), 4, 21),
panel = function(...) {
panel.fill("hotpink")
panel.voronoi(...)
})
## insert some missing values
xyz$z[1:10] <- NA
## the default na.rm = FALSE shows missing polygons
tileplot(z ~ x * y, xyz, border = "black",
col.regions = grey.colors(100),
pch = ifelse(is.na(xyz$z), 4, 21),
panel = function(...) {
panel.fill("hotpink")
panel.voronoi(...)
})
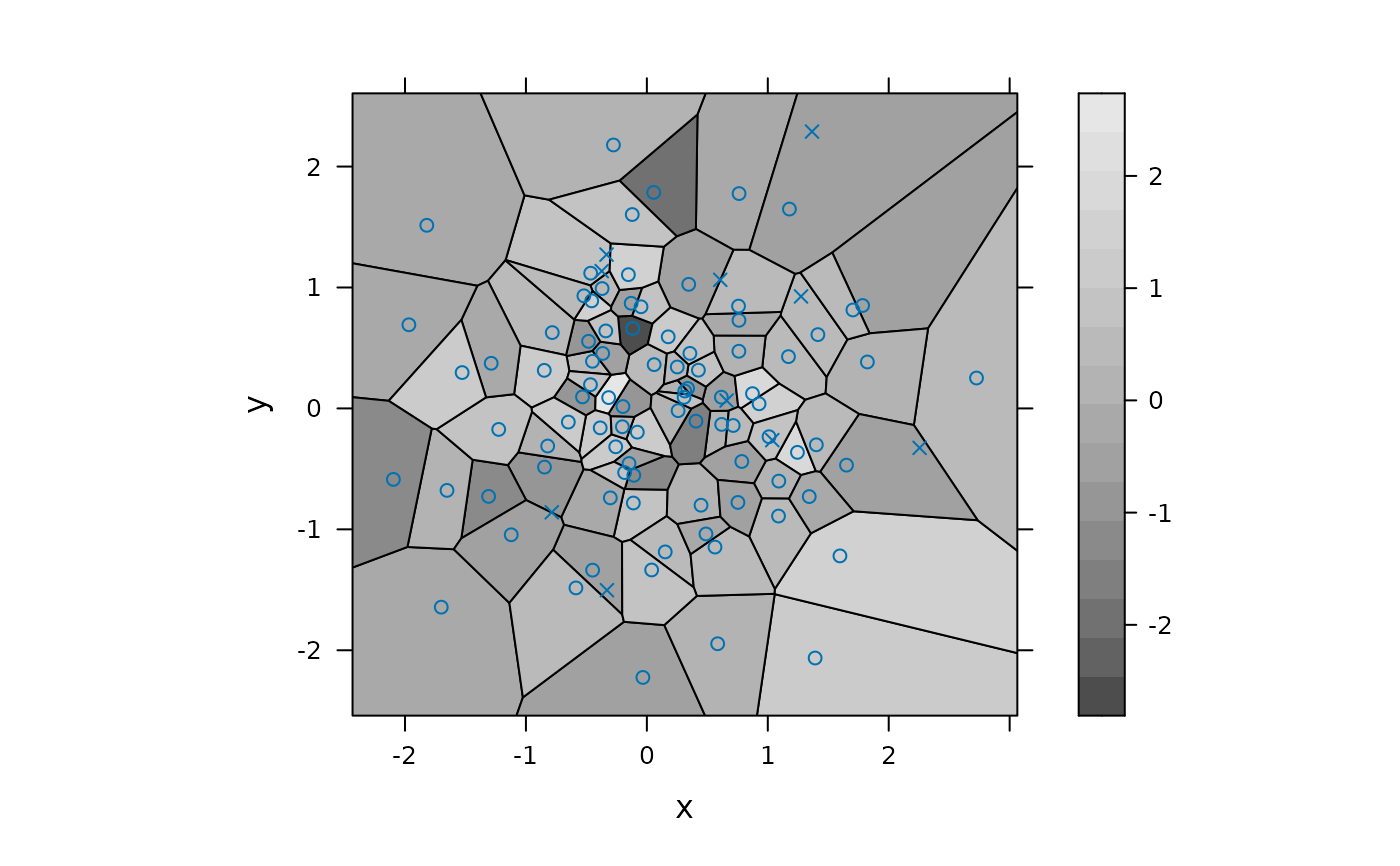
 ## use na.rm = TRUE to ignore points with missing values
update(trellis.last.object(), na.rm = TRUE)
## use na.rm = TRUE to ignore points with missing values
update(trellis.last.object(), na.rm = TRUE)
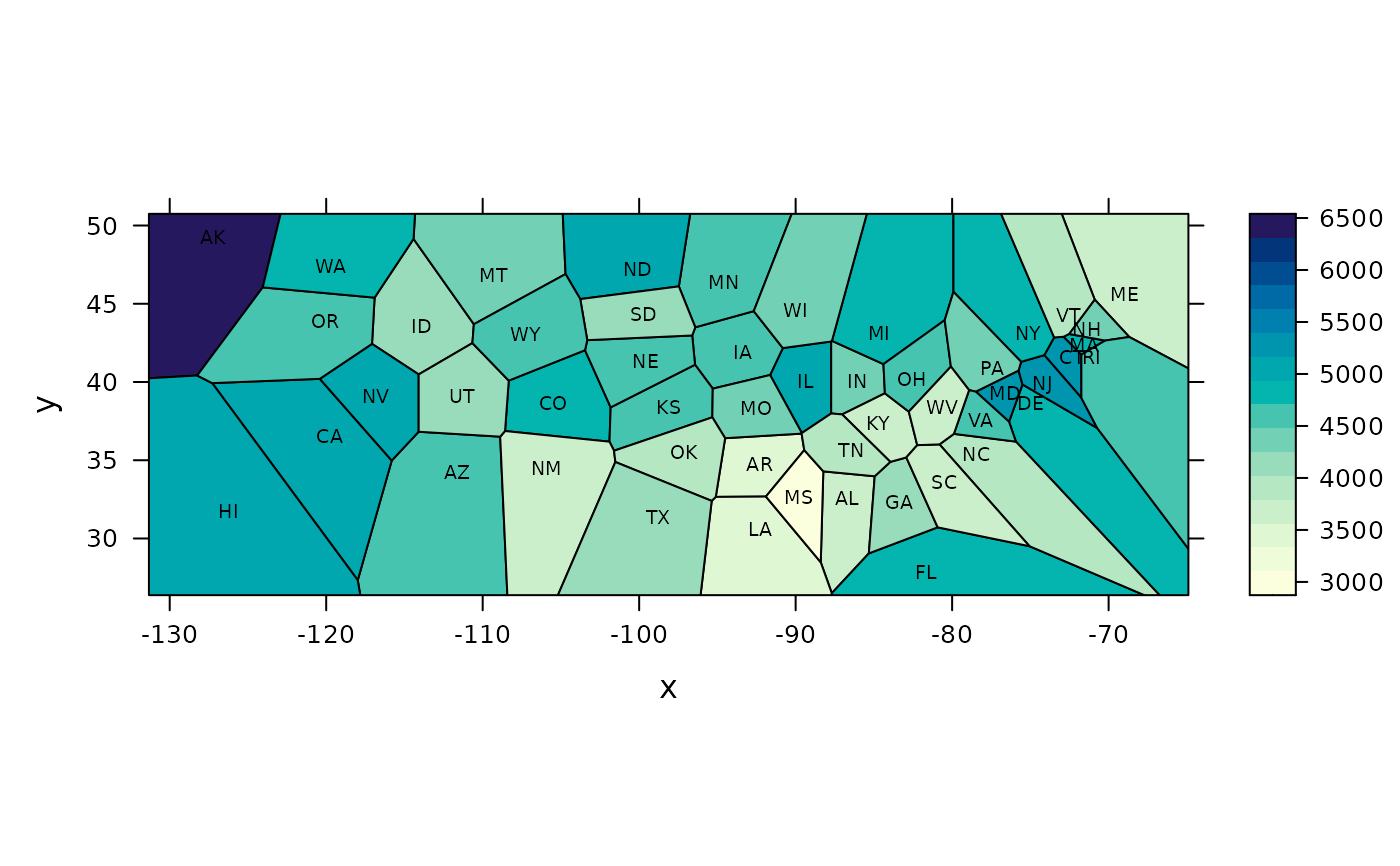
 ## a quick and dirty approximation to US state boundaries
tmp <- state.center
tmp$Income <- state.x77[,"Income"]
tileplot(Income ~ x * y, tmp, border = "black",
panel = function(x, y, ...) {
panel.voronoi(x, y, ..., points = FALSE)
panel.text(x, y, state.abb, cex = 0.6)
})
## a quick and dirty approximation to US state boundaries
tmp <- state.center
tmp$Income <- state.x77[,"Income"]
tileplot(Income ~ x * y, tmp, border = "black",
panel = function(x, y, ...) {
panel.voronoi(x, y, ..., points = FALSE)
panel.text(x, y, state.abb, cex = 0.6)
})