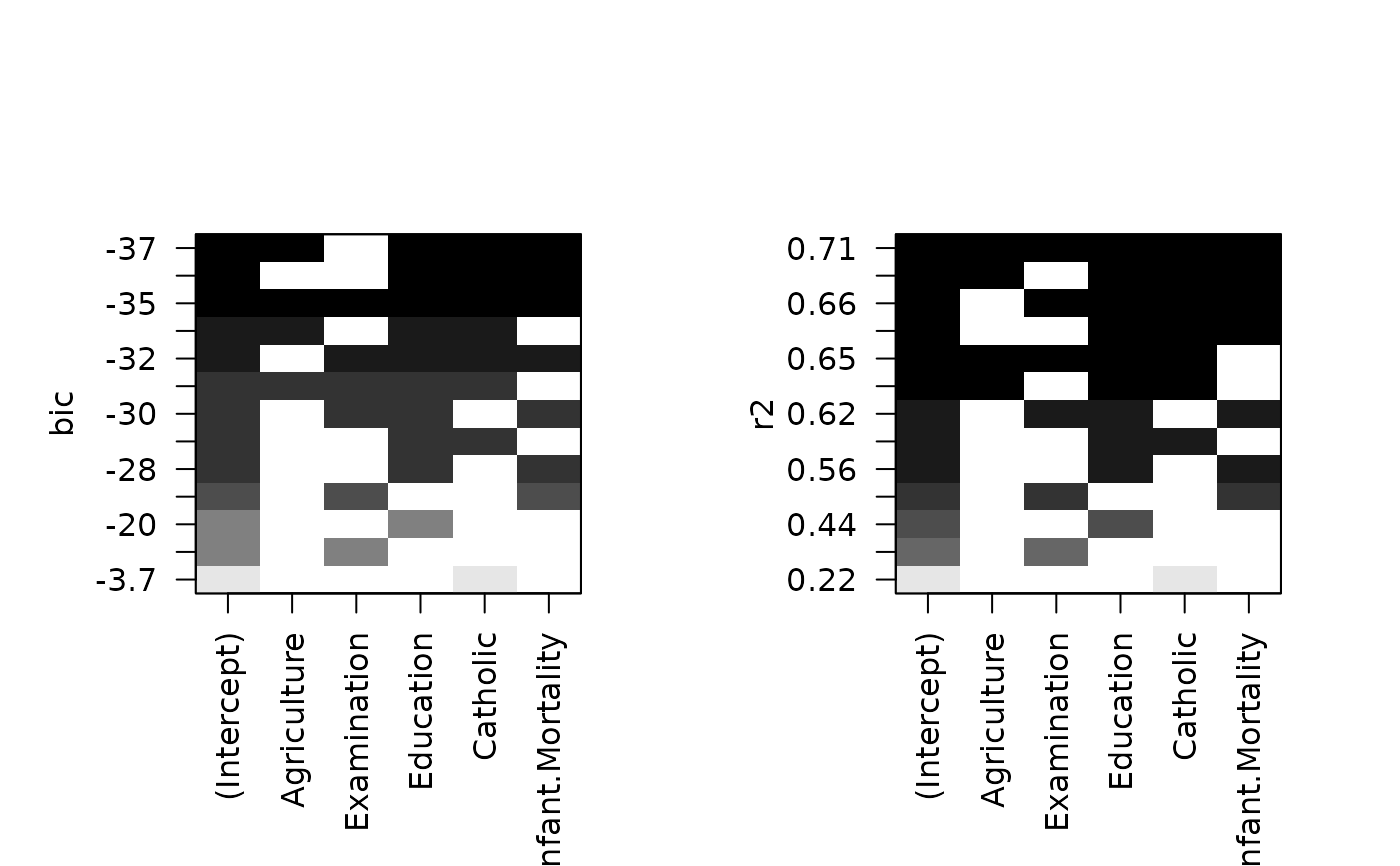
Plots a table of models showing which variables are in each model. The
models are ordered by the specified model selection statistic. This plot
is particularly useful when there are more than ten or so models and the simple table
produced by summary.regsubsets is too big to read.
# S3 method for class 'regsubsets'
plot(x, labels=obj$xnames, main=NULL, scale=c("bic", "Cp", "adjr2", "r2"),
col=gray(seq(0, 0.9, length = 10)),...)
Arguments
- x
regsubsets object
- labels
variable names
- main
title for plot
- scale
which summary statistic to use for ordering plots
- col
Colors: the last color should be close to but distinct from
white
- ...
other arguments
Author
Thomas Lumley, based on a concept by Merlise Clyde