Add Vertices to a Plot
network.vertex.Rdnetwork.vertex adds one or more vertices (drawn using
polygon) to a plot.
network.vertex(
  x,
  y,
  radius = 1,
  sides = 4,
  border = 1,
  col = 2,
  lty = NULL,
  rot = 0,
  lwd = 1,
  ...
)
Arguments
- x
a vector of x coordinates.
- y
a vector of y coordinates.
- radius
a vector of vertex radii.
- sides
a vector containing the number of sides to draw for each vertex.
- border
a vector of vertex border colors.
- col
a vector of vertex interior colors.
- lty
a vector of vertex border line types.
- rot
a vector of vertex rotation angles (in degrees).
- lwd
a vector of vertex border line widths.
- ...
Additional arguments to
polygon
Value
None
Details
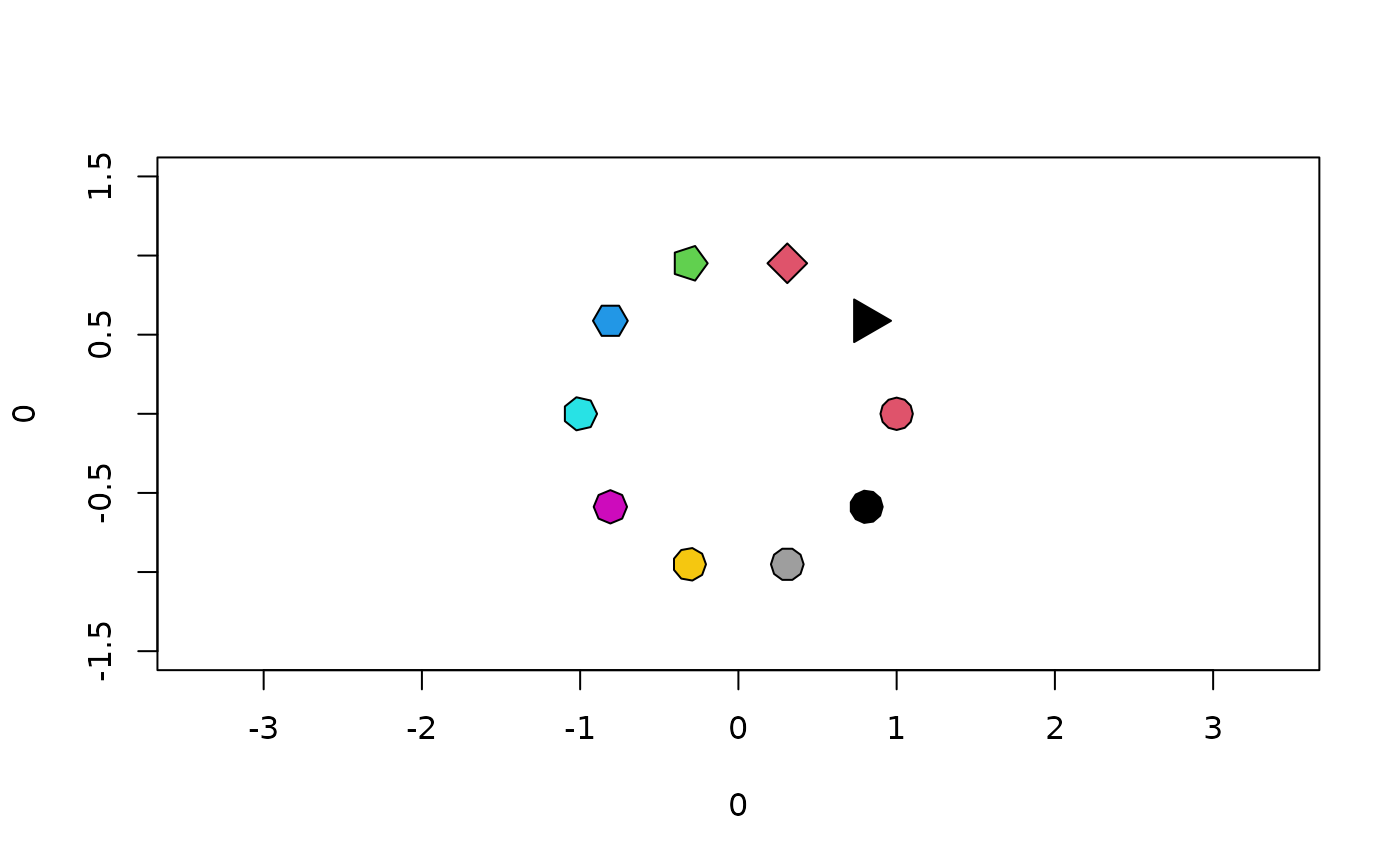
network.vertex draws regular polygons of specified radius and number
of sides, at the given coordinates. This is useful for routines such as
plot.network, which use such shapes to depict vertices.
Note
network.vertex is a direct adaptation of
gplot.vertex from the sna package.
References
Butts, C. T. (2008). “network: a Package for Managing Relational Data in R.” Journal of Statistical Software, 24(2). doi:10.18637/jss.v024.i02