Plot lmList Confidence Intervals
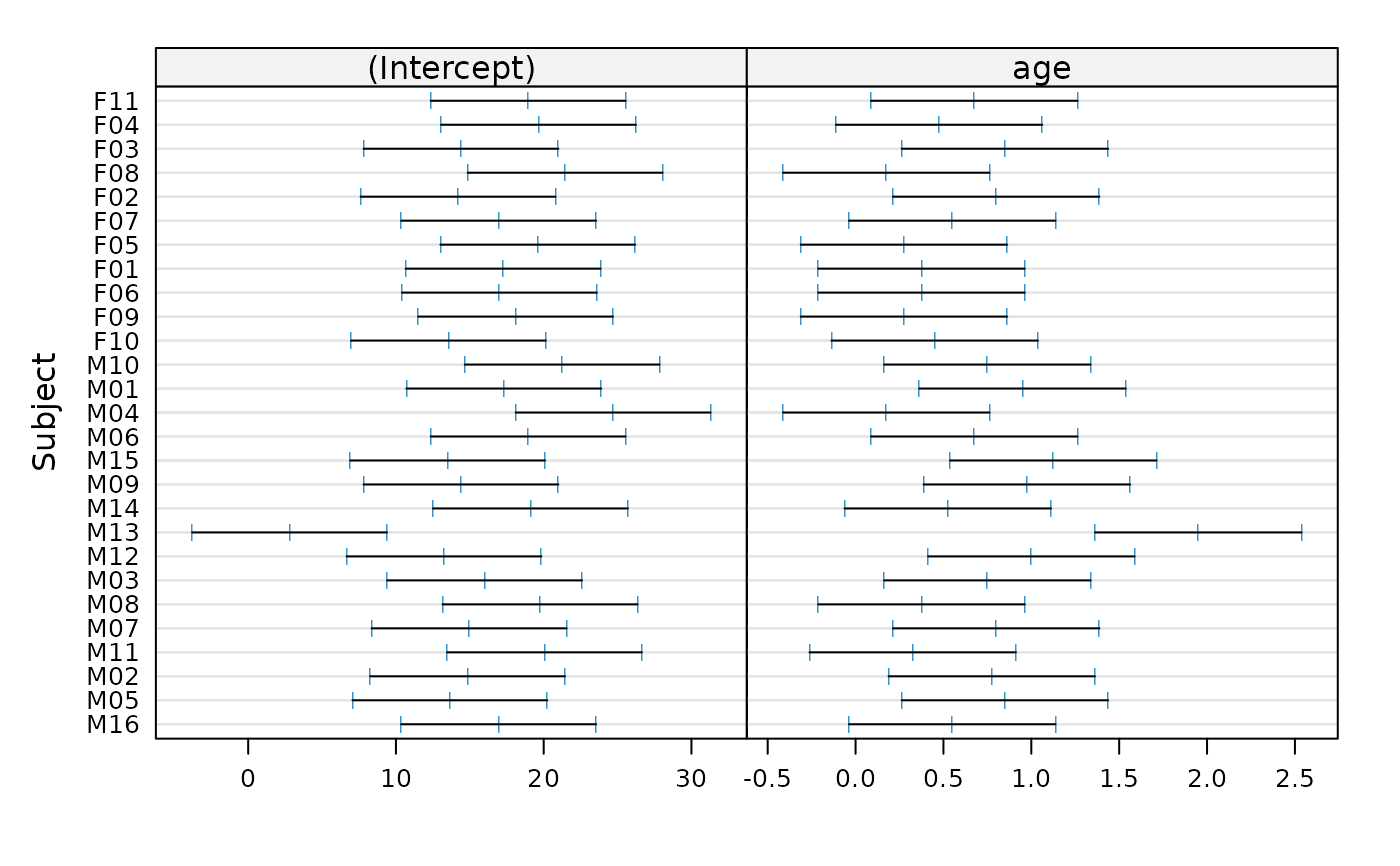
plot.intervals.lmList.RdA Trellis dot-plot of the confidence intervals on the linear model
coefficients is generated, with a different panel for each
coefficient. Rows in the dot-plot correspond to the names of the
lm components of the lmList object used to produce
x. The lower and upper confidence limits are connected by
a line segment and the estimated coefficients are marked with a
"+".
Arguments
- x
an object inheriting from class
"intervals.lmList", representing confidence intervals and estimates for the coefficients in thelmcomponents of thelmListobject used to producex.- xlab, ylab
axis labels, each with a sensible default.
- strip
- ...
optional arguments passed to the
dotplotfunction (see above).
Value
a Trellis plot with the confidence intervals on the coefficients of
the individual lm components of the lmList that
generated x.