Basic 4- and 6-panel GOF
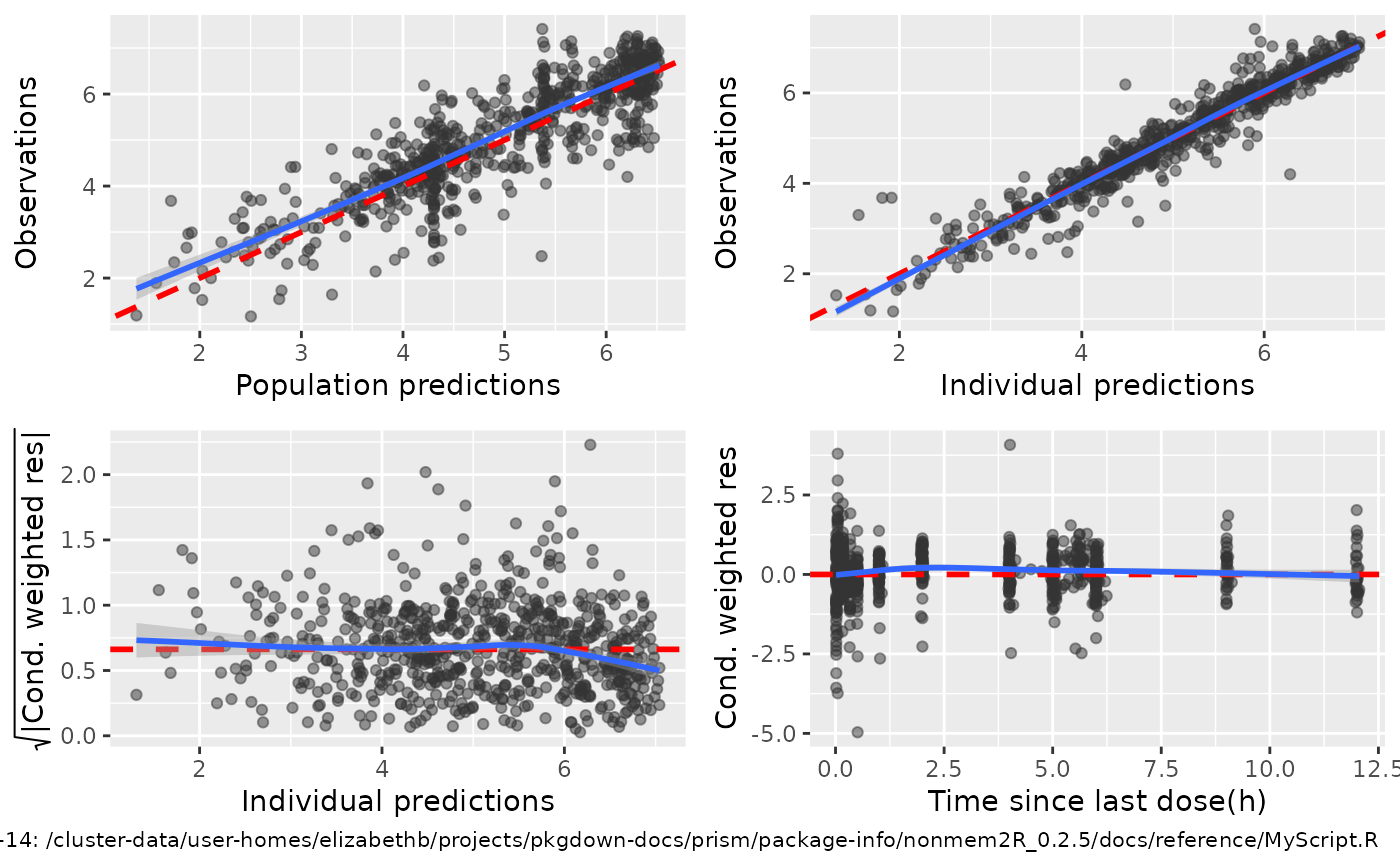
basic.GOF4.Rdbasic.GOF4 provides a 4-panel GOF plot showing
i) Observations (DV) vs population predictions (PRED)
ii) Observations (DV) vs individual predictions (IPRED)
iii) sqrt(abs(CWRES)) vs individual predictions (IPRED), and
iV) CWRES vs TIME or other columns as set by idv
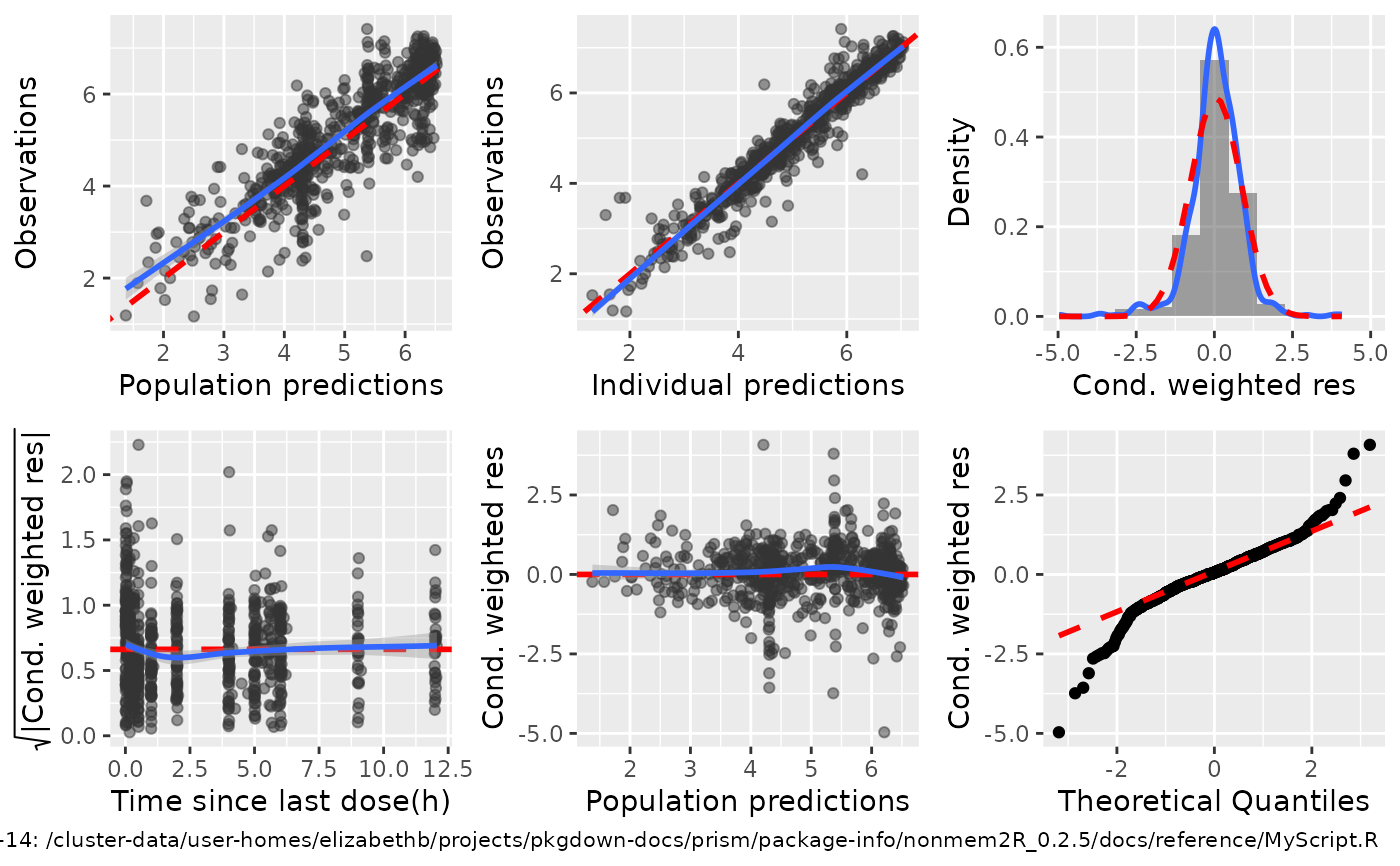
basic.GOF6 provides 2 additional GOF's showing histogram and qqnorm GOF's for CWRES.
Caption is added as reurned by get.caption
basic.GOF4(
  data,
  residual = "CWRES",
  idv1 = "IPRED",
  idv2 = "TIME",
  title = "",
  color = "",
  log.scale = FALSE,
  global.ggplot.options = NULL,
  refline = TRUE,
  add.loess = TRUE,
  control = GOF.control()
)

basic.GOF6(
  data,
  residual = "CWRES",
  idv1 = "IPRED",
  idv2 = "TIME",
  title = "",
  color = "",
  log.scale = FALSE,
  global.ggplot.options = NULL,
  refline = TRUE,
  add.loess = TRUE,
  bins = NA,
  control = GOF.control()
)
Arguments
- data
data.frame to plot
- residual
column name for residuals, default="CWRES"
- idv1
independent variable for plot of sqrt of absolute CWRES
- idv2
independent variable for plot of CWRES
- title
title
- color
data columns to set different colors in plot, interpreted as factor
- log.scale
use log scale for DV, IPRED and PRED (TRUE) or normal scale (FALSE)
- global.ggplot.options
ggplot option added to each ggplot before plotting/returning object
- refline
add reference line (default =TRUE) or not (FALSE)
- add.loess
add loess smoother to plot (TRUE), or not (FALSE)
- control
an optional list of control settings. See GOF.control for the names of the settable control values and their effect.
- bins
number of histogram bins, if NA, bins are set using Sturges' formula
Examples
# Get path to the example files included in nonmem2R package
file1 <- system.file("extdata", "sdtab999", package = "nonmem2R")
sdtab<-read.table(file=file1,skip=1,header=TRUE)
set.script.name("MyScript.R")
## Example 4 panel basic GOF
basic.GOF4(subset(sdtab,DV>0),idv2="TAPD")
#> `geom_smooth()` using formula = 'y ~ x'
#> `geom_smooth()` using formula = 'y ~ x'
#> `geom_smooth()` using formula = 'y ~ x'
#> Warning: The following aesthetics were dropped during statistical transformation: x and
#> y.
#> ℹ This can happen when ggplot fails to infer the correct grouping structure in
#>   the data.
#> ℹ Did you forget to specify a `group` aesthetic or to convert a numerical
#>   variable into a factor?
#> `geom_smooth()` using formula = 'y ~ x'
#> `geom_smooth()` using formula = 'y ~ x'

## Example 6 panel basic GOF
basic.GOF6(subset(sdtab,DV>0),idv1="TAPD",idv2="PRED")
#> `geom_smooth()` using formula = 'y ~ x'
#> `geom_smooth()` using formula = 'y ~ x'
#> `geom_smooth()` using formula = 'y ~ x'
#> Warning: `stat(density)` was deprecated in ggplot2 3.4.0.
#> ℹ Please use `after_stat(density)` instead.
#> ℹ The deprecated feature was likely used in the nonmem2R package.
#>   Please report the issue to the authors.
#> Warning: The following aesthetics were dropped during statistical transformation: x and
#> y.
#> ℹ This can happen when ggplot fails to infer the correct grouping structure in
#>   the data.
#> ℹ Did you forget to specify a `group` aesthetic or to convert a numerical
#>   variable into a factor?
#> `geom_smooth()` using formula = 'y ~ x'
#> `geom_smooth()` using formula = 'y ~ x'
## Example 6 panel basic GOF
basic.GOF6(subset(sdtab,DV>0),idv1="TAPD",idv2="PRED")
#> `geom_smooth()` using formula = 'y ~ x'
#> `geom_smooth()` using formula = 'y ~ x'
#> `geom_smooth()` using formula = 'y ~ x'
#> Warning: `stat(density)` was deprecated in ggplot2 3.4.0.
#> ℹ Please use `after_stat(density)` instead.
#> ℹ The deprecated feature was likely used in the nonmem2R package.
#> Please report the issue to the authors.
#> Warning: The following aesthetics were dropped during statistical transformation: x and
#> y.
#> ℹ This can happen when ggplot fails to infer the correct grouping structure in
#> the data.
#> ℹ Did you forget to specify a `group` aesthetic or to convert a numerical
#> variable into a factor?
#> `geom_smooth()` using formula = 'y ~ x'
#> `geom_smooth()` using formula = 'y ~ x'