clplot displays a plot of lines for which the colors are dependent
upon the x and y values. clplot is similar to color.scale.lines
except that while the latter calculates a color for each unique value,
clplot assigns colors to groups of values within the cutpoints defined
by levels.
clplot(x,y,ylab=deparse(substitute(y)),xlab=deparse(substitute(x)),
  levels=seq(min(y)+(max(y)-min(y))/5,max(y)-(max(y)-min(y))/5,length.out=4),
  cols=c("black","blue","green","orange","red"),lty=1,showcuts=FALSE,...)
Arguments
- x,y
numeric data vectors.
- ylab,xlab
Labels for the X and Y axes.
- levels
Cut points to assign colors to the values of x and
y.
- cols
The colors to be assigned.
- lty
The line type.
- showcuts
Whether to show the positions of the cut points.
- ...
additional arguments passed to plot or lines.
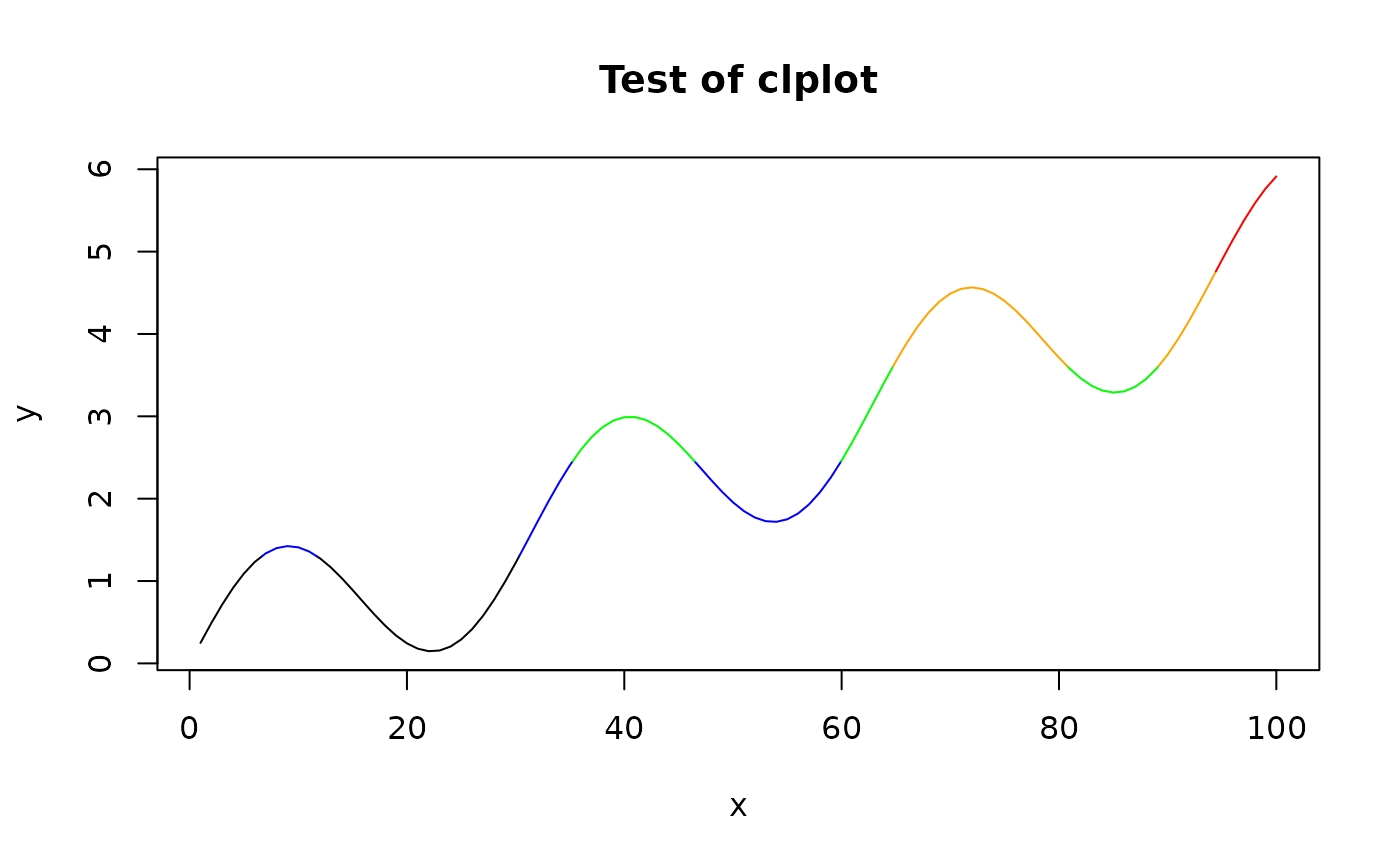
Examples
 x<-seq(1,100)
 y<-sin(x/5)+x/20
 clplot(x,y,main="Test of clplot")