Plot multiple variables as polygons on a radial grid
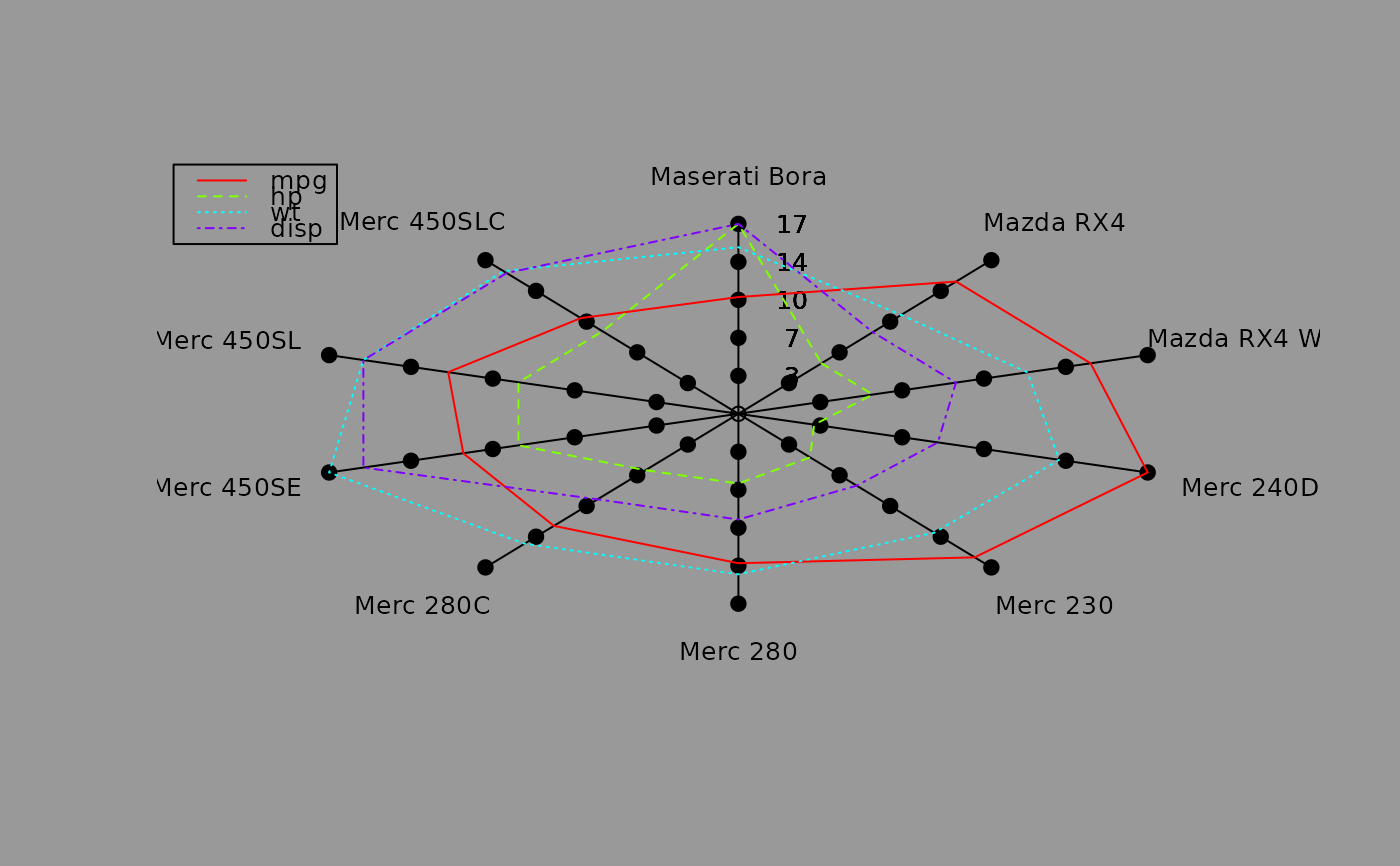
diamondplot.Rddiamondplot displays a plot of polygons on a radial grid representing the relationships between one or more attributes of data objects. For a slightly different style of plot, see the "spiderweb plot" example in radial.plot.
diamondplot(x, bg=gray(0.6), col=rainbow,name="", ...)Arguments
Value
nil