Display a barplot with a gap (missing range) on one axis
gap_barp.RdDisplays a barplot with a missing range.
Arguments
- height
a vector of data values
- gap
the range of values to be left out
- width
the proportion of bar width to bar spacing divided by 2. width=1 means no spaces between the bars.
- names.arg
labels for the bars.
- col
color(s) in which to plot the values
- main
title for the plot.
- xlab
label for the x axis
- ylab
label for the y axis
- xlim
Optional x limits for the plot
- ylim
optional y limits for the plot
- x
optional x positions for the bars.
- height.at
explicit positions for the y axis ticks
- height.lab
explicit labels for the y axis ticks.
- ...
arguments passed to barp.
Value
The center positions of the bars.
Details
Displays a barplot omitting a range of values on the X or Y axis. Typically used when there is a relatively large gap in the range of values represented as bar heights. See axis.break for a brief discussion of plotting on discontinuous coordinates.
If the user does not ask for specific y limits, the function will calculate limits based on the range of the data values. If passing specific limits, remember to subtract the gap from the upper or lower limit.
See also
Examples
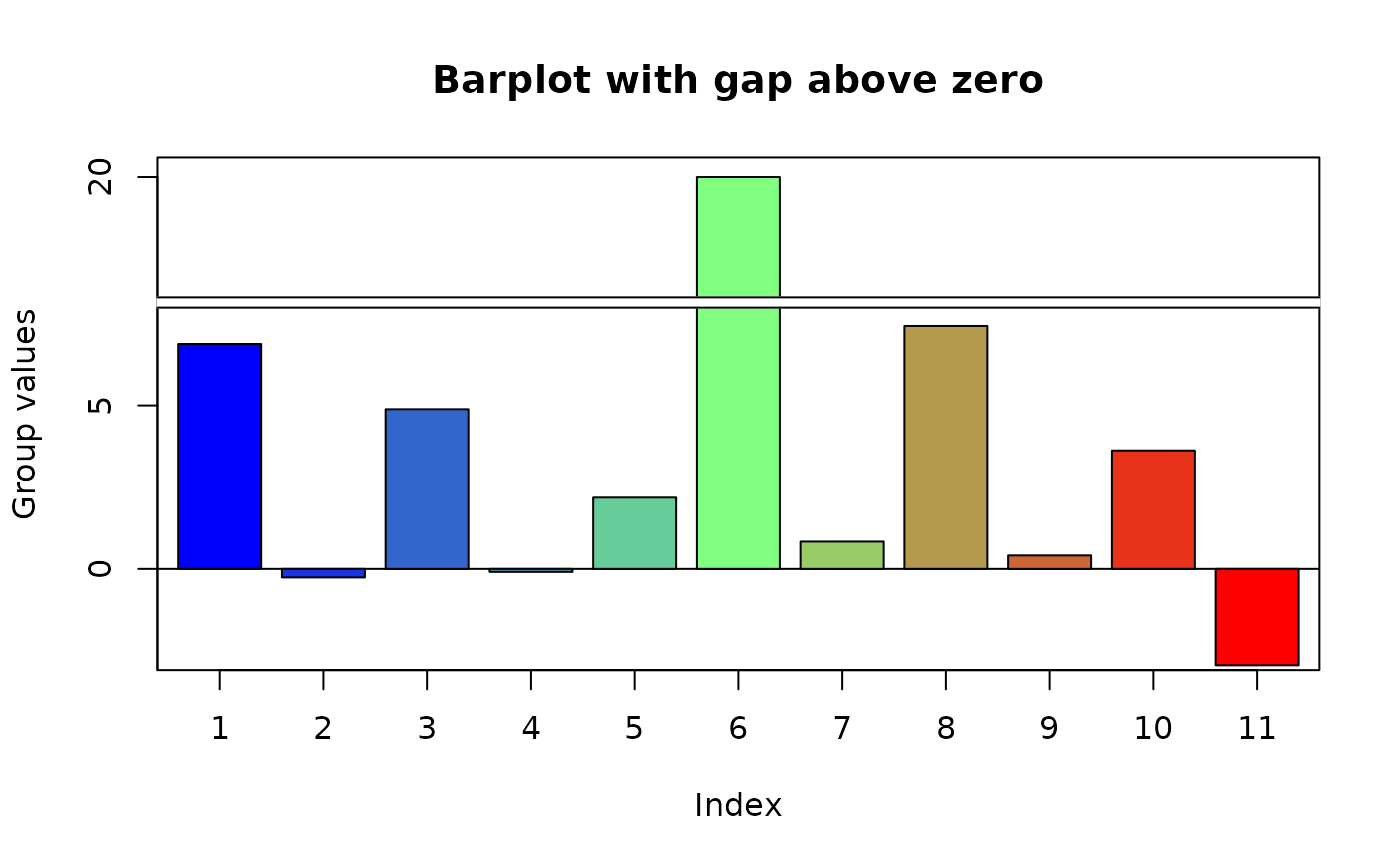
oneout<-c(rnorm(5,sd=5),20,rnorm(5,sd=5))
gap_barp(oneout,gap=c(8,16),xlab="Index",height.at=c(-5,0,5,20),
ylab="Group values",main="Barplot with gap above zero")
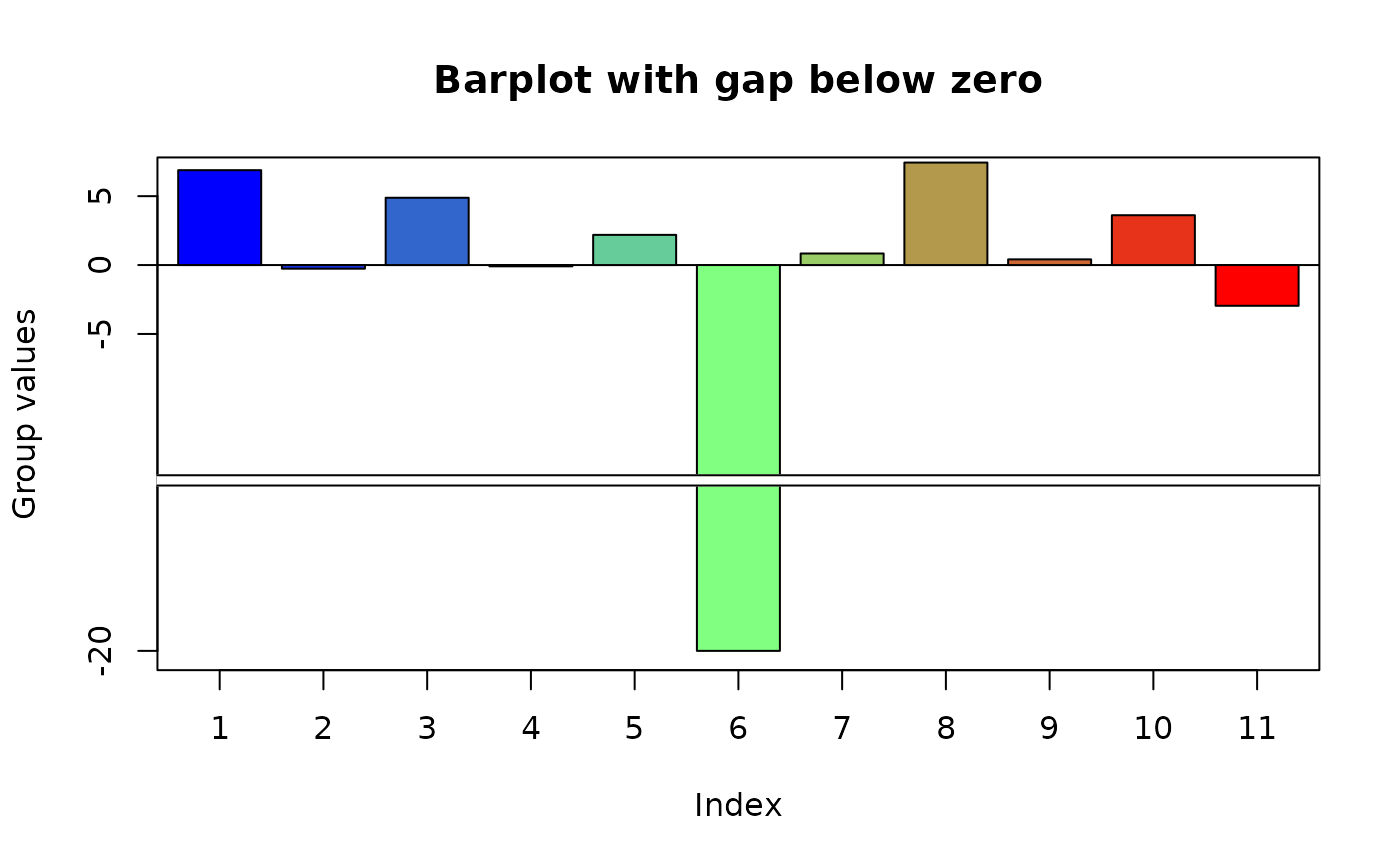
 oneout[6]<--20
gap_barp(oneout,gap=c(-8,-16),xlab="Index",height.at=c(-20,-5,0,5),
ylab="Group values",main="Barplot with gap below zero")
oneout[6]<--20
gap_barp(oneout,gap=c(-8,-16),xlab="Index",height.at=c(-20,-5,0,5),
ylab="Group values",main="Barplot with gap below zero")