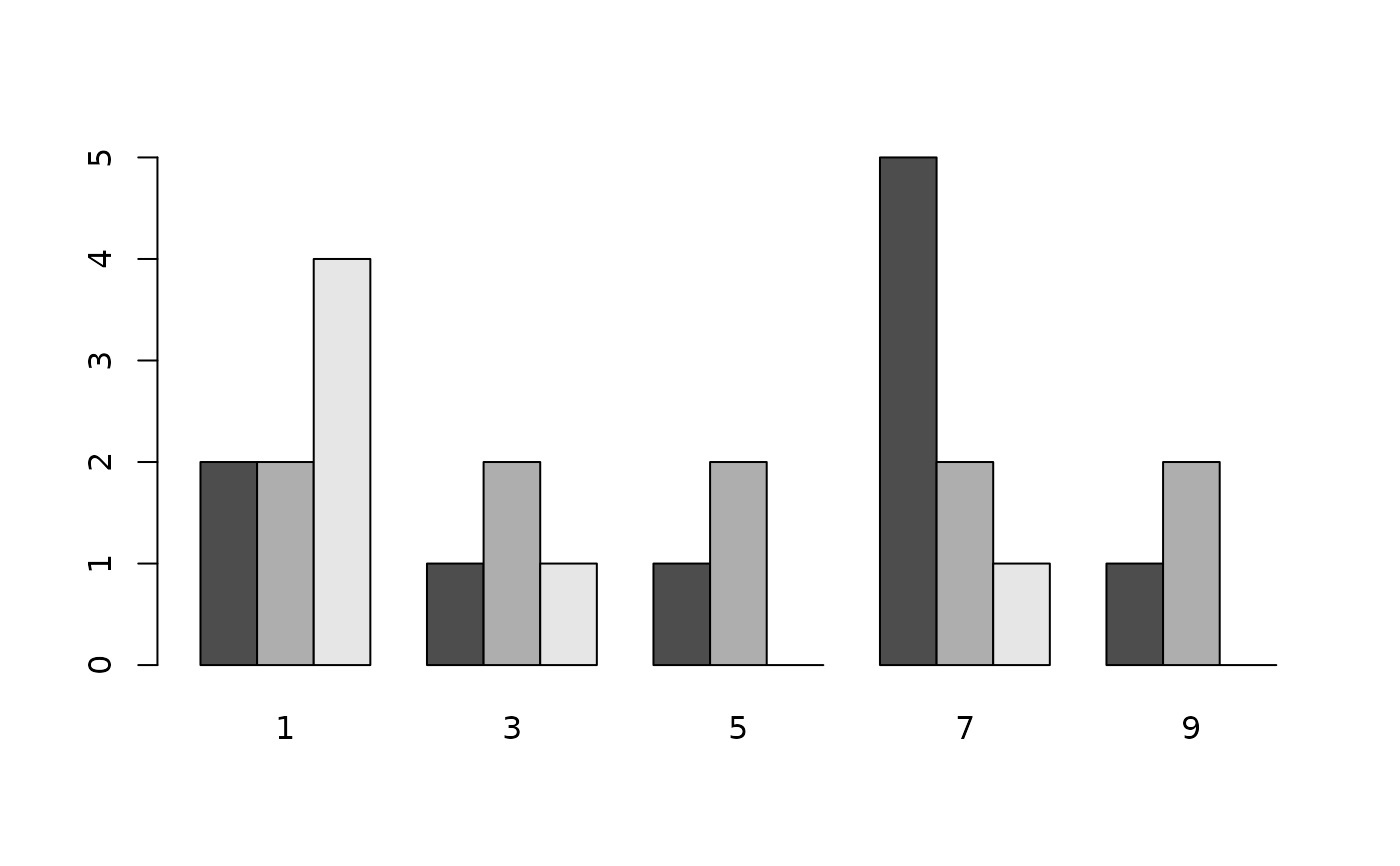
Plot a multiple histogram, as a barplot
multhist.RdGiven a list, plots a side-by-side barplot containing the histograms of the elements
multhist(x,beside=TRUE,freq=NULL,probability=!freq,plot.it=TRUE,...)Arguments
- x
a list of numeric vectors
- beside
plot histogram bars for groups side-by-side?
- freq
logical; if 'TRUE', the histogram graphic is a representation of frequencies, the 'counts' component of the result; if 'FALSE', probability densities, component 'density', are plotted (so that the histogram has a total area of one). Defaults to 'TRUE' if 'probability' is not specified (does not consider equidistant breaks as in hist)
- probability
an alias for '!freq', for S compatibility
- plot.it
Whether or not to display the histogram.
- ...
Value
A list including the return value for the first call to hist (itself a list) and the values for the bar heights.
Note
The 'inside' argument to barplot (which is not currently implemented in barplot anyway) is deleted from the argument list. The default value of NULL for freq is for consistency with hist but is equivalent to TRUE.