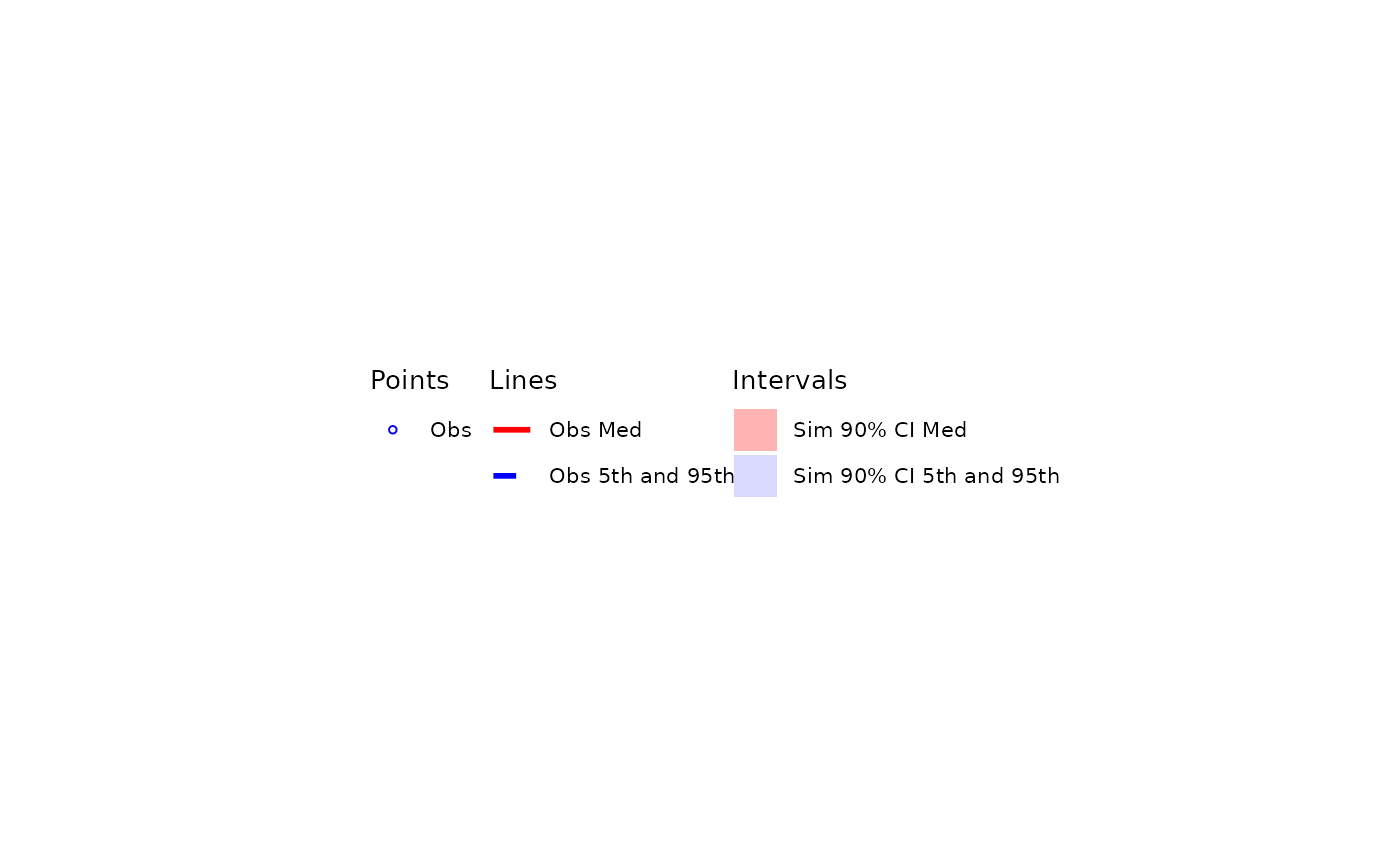
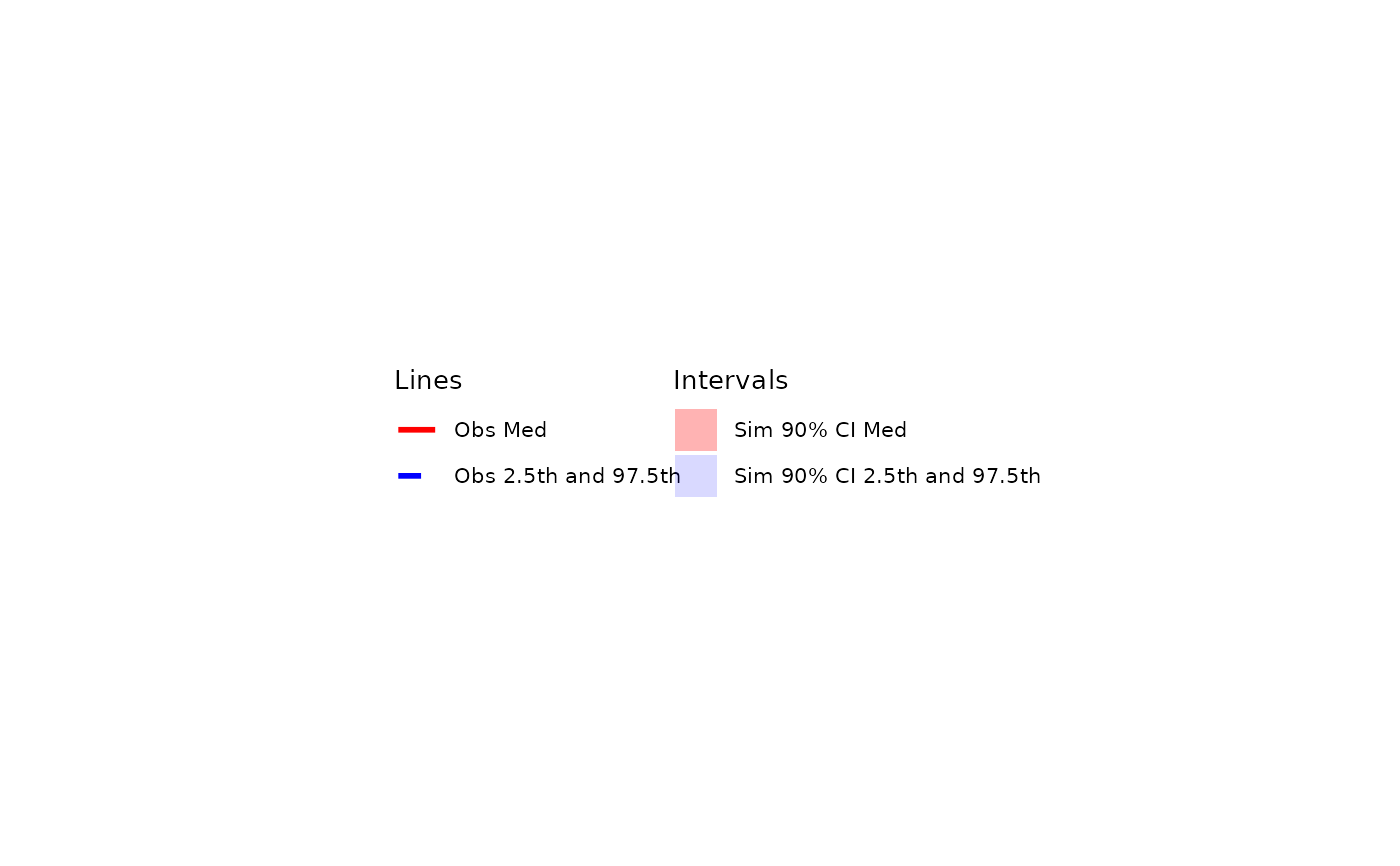
Plot a legend for a visual predictive check (VPC)
Arguments
- ci
simulated confidence interval plotted. Should match argument passed to
vpc::vpc(). Default is c(0.05, 0.95).- pi
prediction intervals plotted. Should match argument passed to
vpc::vpc(). Default is c(0.05, 0.95).- shown
Named list of logicals specifying which layers to include on the plot. Passed to
showargument ofvpc::vpc().Defaults are:
Observed points:
obs_dv= TRUE.Observed quantiles:
obs_ci= TRUESimulated inter-quantile range:
pi= FALSESimulated inter-quantile area:
pi_as_area= FALSESimulated Quantile CI:
pi_ci= TRUEObserved Median:
obs_median= TRUESimulated Median:
sim_median= FALSESimulated Median CI:
sim_median_ci= TRUE
- lloq
label for lower limit of quantification in the plot legend.
- update
list containing the plot elements to be updated. Default is set by
pmxhelpr_vpc_theme().- ...
Other arguments passed to
ggplot2::theme().
Value
a ggplot2 object

