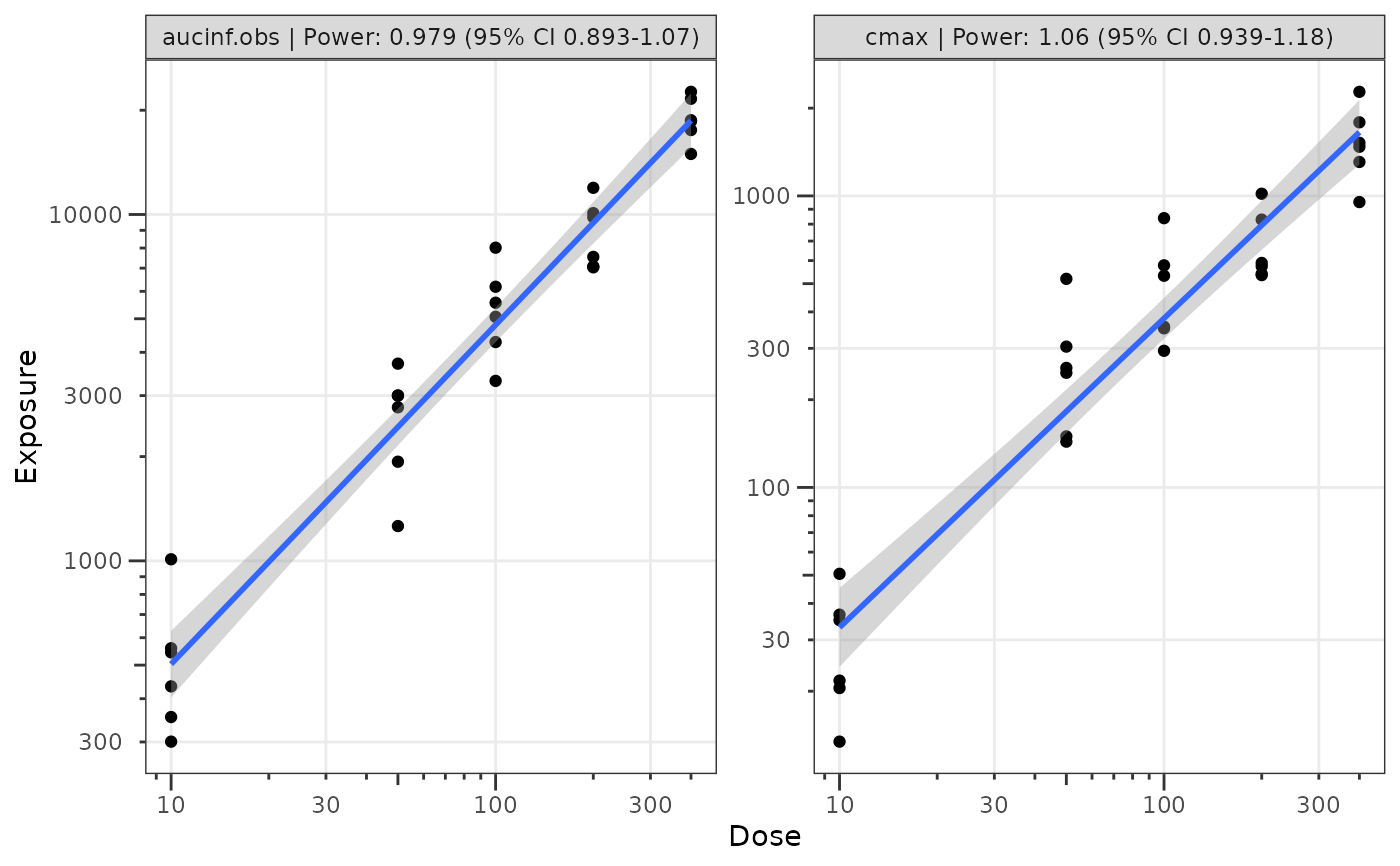
Plot a dose-proportionality assessment via power law (log-log) regression
Source:R/plot_doseprop.R
plot_doseprop.RdPlot a dose-proportionality assessment via power law (log-log) regression
plot_doseprop(
  data,
  metrics,
  metric_var = "PPTESTCD",
  exp_var = "PPORRES",
  dose_var = "DOSE",
  method = "normal",
  ci = 0.95,
  sigdigits = 3,
  se = TRUE
)
Arguments
- data
Input dataset for log-log regression. Default expected format is output from
PKNCA::pk.nca()(i.e., SDTM PP formatting)- metrics
character vector of exposure metrics in
datato plot- metric_var
character string of variable in
datacontaining the values provided inmetrics. Default is "PPTESTCD".- exp_var
Character string specifying the variable in
datacontaining the exposure metric (dependent variable) Default is "PPORRES".- dose_var
Character string specifying the variable in
datacontaining the dose (independent variable) Default is "DOSE".- method
character string specifying the distribution to be used to derived the confidence interval. Options are "normal" (default) and "tdist"
- ci
confidence interval to be calculated. Options are 0.95 (default) and 0.90
- sigdigits
number of significant digits for rounding
- se
logical to display confidence interval around regression. Default is
TRUE.
Value
a ggplot plot object