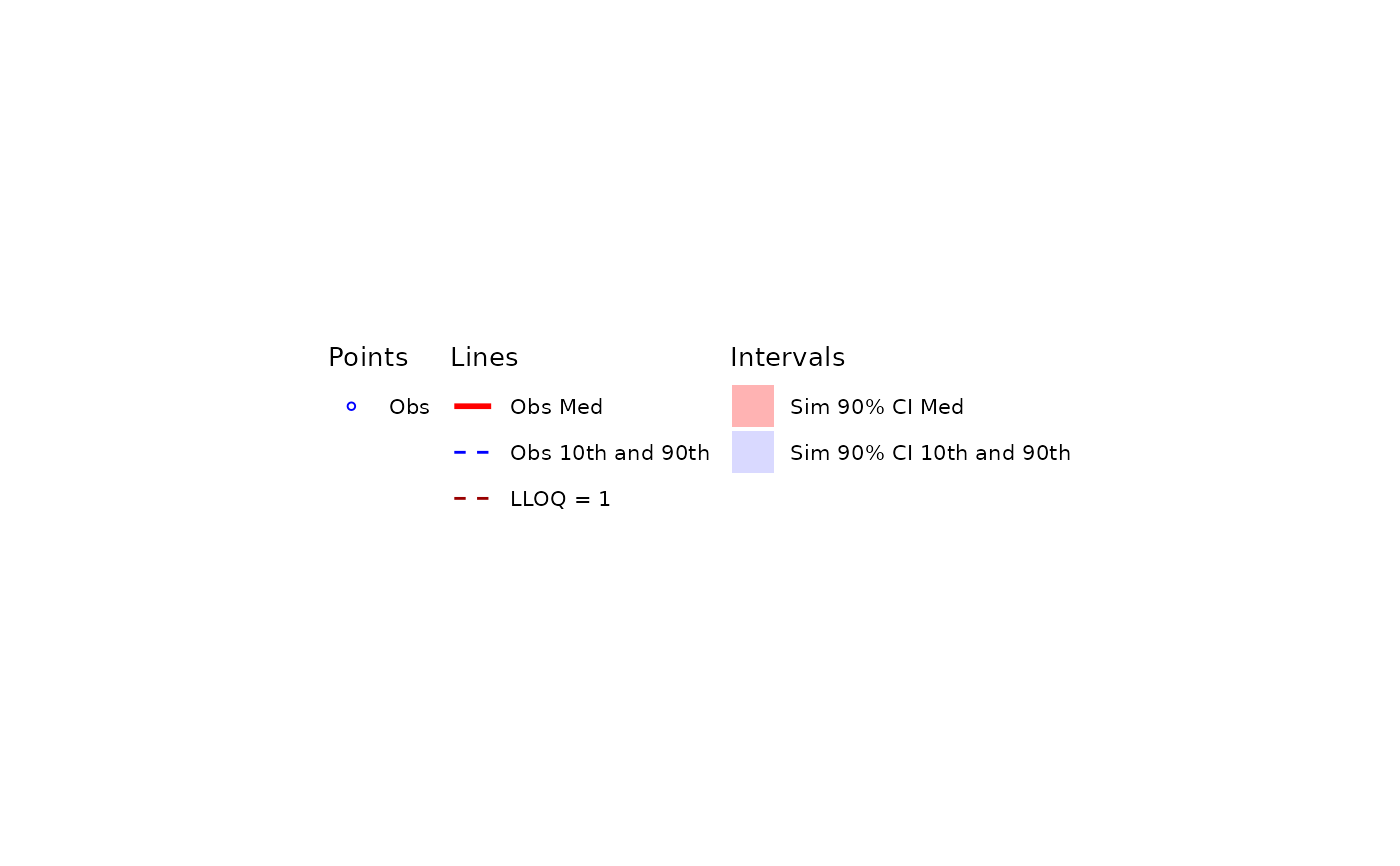
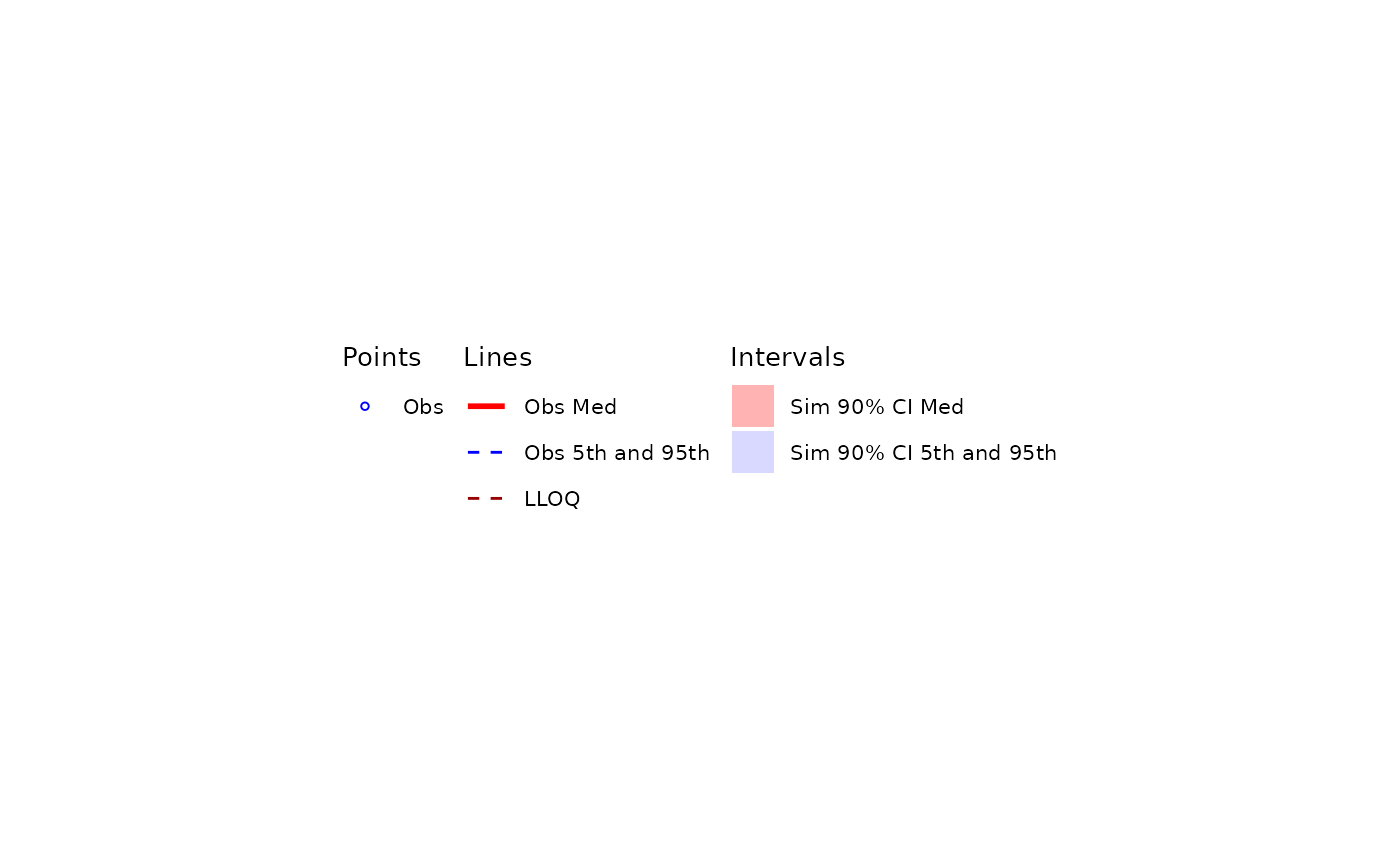
Plot a legend for a visual predictive check (VPC)
Arguments
- ci
Numeric confidence level for simulation intervals (e.g.,
0.90for 90% CI). Should match argument passed toplot_vpc_cont(). Default is0.90.- pi
prediction intervals plotted. Should match argument passed to
plot_vpc_cont(). Default is c(0.05, 0.95). Ignored whentype = "cens"(cens VPCs do not have prediction intervals).- shown
Layer visibility settings created by
plot_vpc_shown(). Defaults can be viewed by runningplot_vpc_shown()with no arguments.- loq
Numeric scalar or vector of LLOQ values to label in the legend, or
NULLto omit. One legend entry is drawn at the highest value, matching the single LLOQ line per panel, with the style'sloq_linelinetype and linewidth. Passstats$config$loqfrom adf_vpcstats()result to mirror the reference lines drawn byplot_build_vpc().- show_loq_value
Logical. If
TRUE(default), the LLOQ entry is labeled"LLOQ = <value>"with the highestloqvalue; ifFALSE, it is labeled"LLOQ". Ignored whenloqisNULL.- style
A
ggstylekit::style_spec()controlling legend aesthetics. Defaults tostyle_vpc(); view the defaults by runningstyle_vpc()with no arguments. Should match thestylepassed toplot_vpc_cont(). The per-series maps supply each key's color, fill, shape, linetype, and linewidth;legend.title.positionandlegend.title.hjustplace the legend titles. Other style fields do not apply to the legend panel.- type
One of
"cont"(default) or"cens". Selects the labels and layer set the legend describes. Under"cont", the central-tendency entries are labeled"Obs Med","Sim Med", and"Sim <ci>% CI Med"and the pi entries ("Obs <p1>th and <p2>th","Sim <p1>th - <p2>th","Sim <ci>% CI <p1>th and <p2>th") are included when theirshownkeys are on. Under"cens", the three central-tendency labels are relabeled to"Obs Prop BLQ","Sim Prop BLQ","Sim <ci>% CI Prop BLQ"and all pi-related entries are suppressed regardless ofshown(cens VPCs have no prediction interval).- ...
Other arguments passed to
ggplot2::theme(), applied after the style so they override it.- lloq
 Use
loq. Do not pass both.- stats
A
df_vpcstats()result, orNULL(default). When given,ci,pi, andloqdefault tostats$config$ci,stats$config$pi, andstats$config$loq, so the legend matches a plot built from the same container; any of them passed explicitly overrides the container (loq = NULLomits the LLOQ entry).type,shown, andstyleare not stored in the container; pass the ones used for the plot.
Examples
plot_vpc_legend()
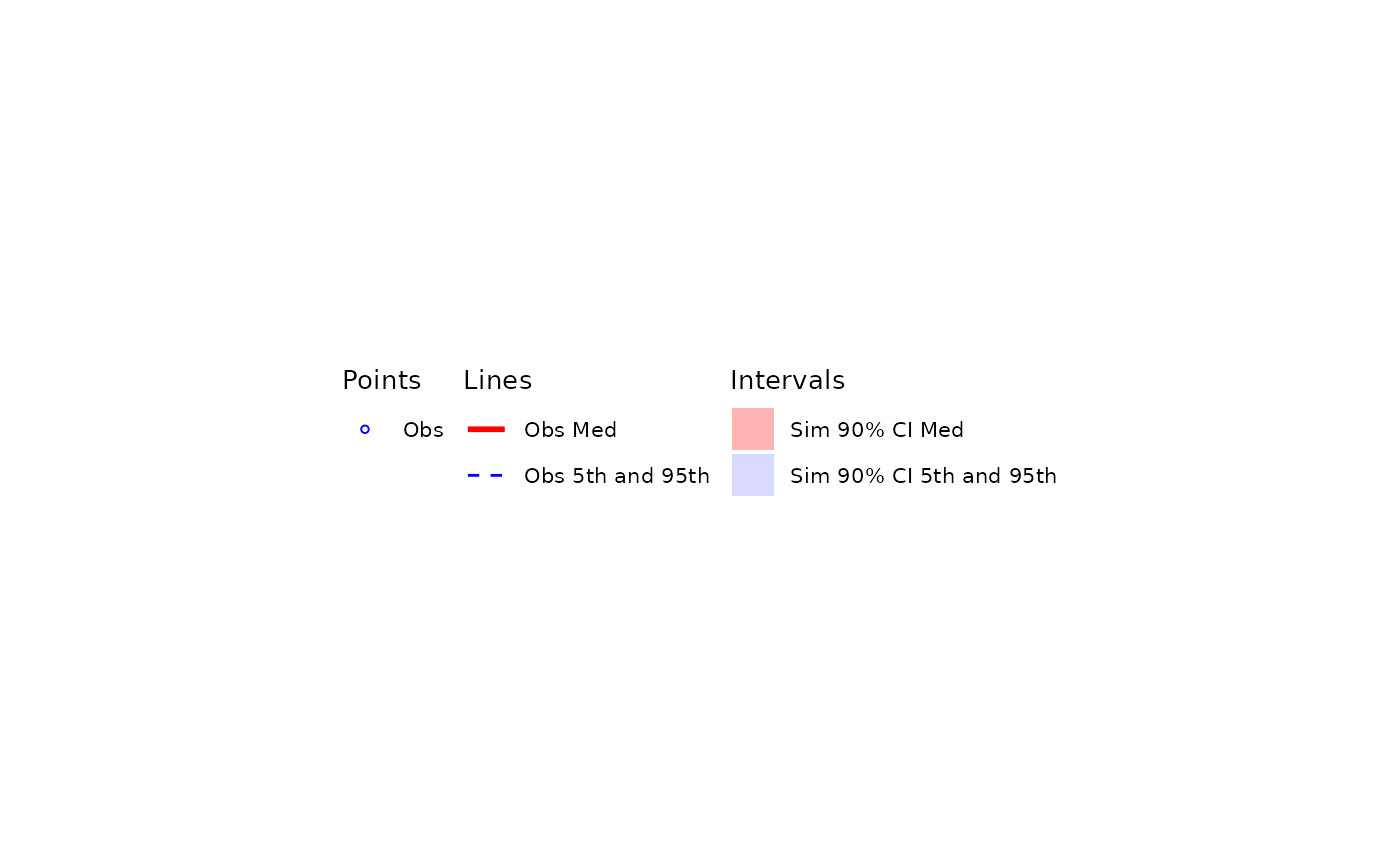 plot_vpc_legend(
pi = c(0.025, 0.975),
ci = 0.95,
shown = plot_vpc_shown(obs_point = FALSE, obs_pi_line = TRUE,
sim_pi_line = FALSE, sim_pi_area = FALSE, sim_pi_ci = TRUE,
obs_median_line = TRUE,
sim_median_line = FALSE, sim_median_ci = TRUE))
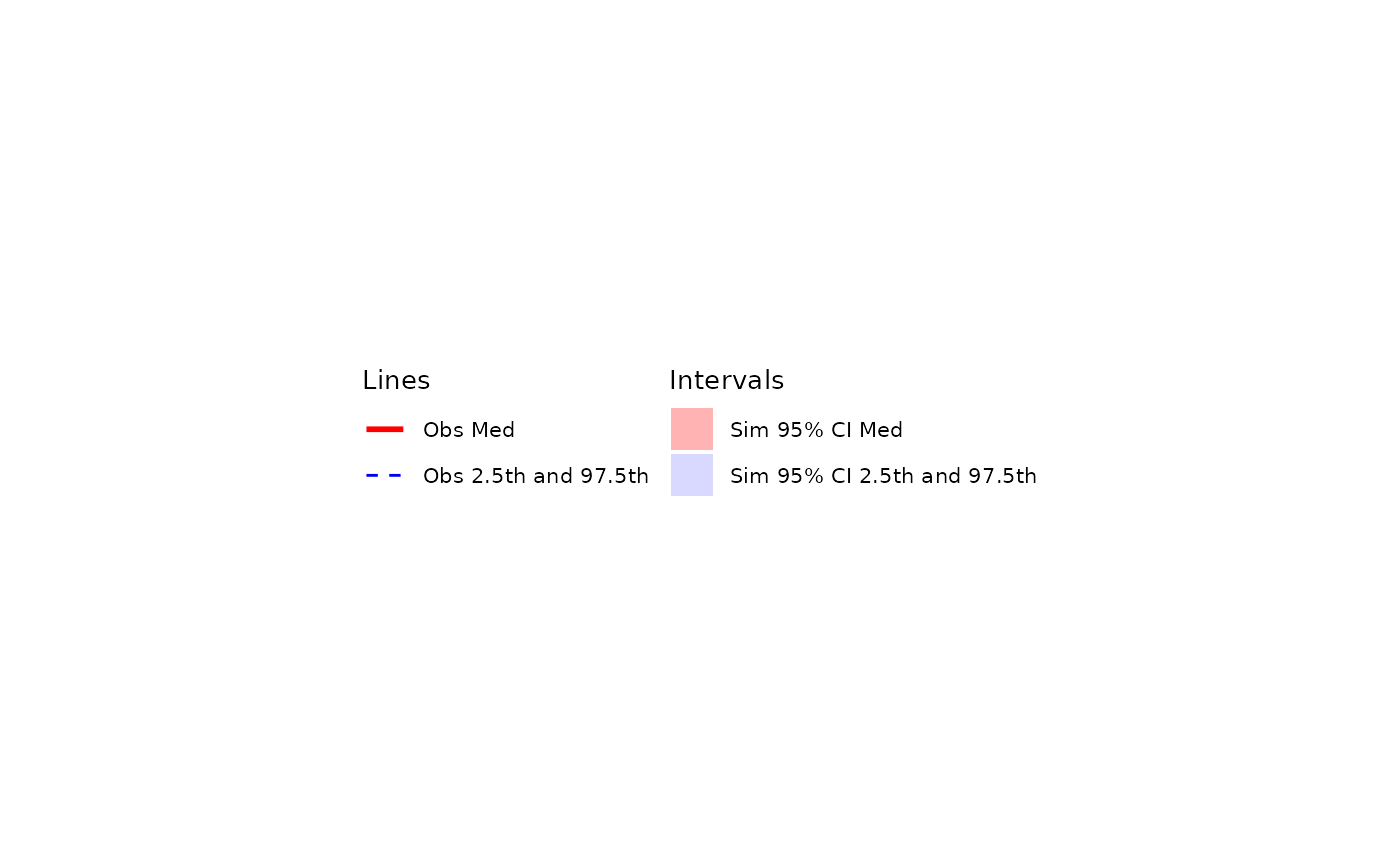 ## Cens VPC legend
plot_vpc_legend(type = "cens", loq = 1)
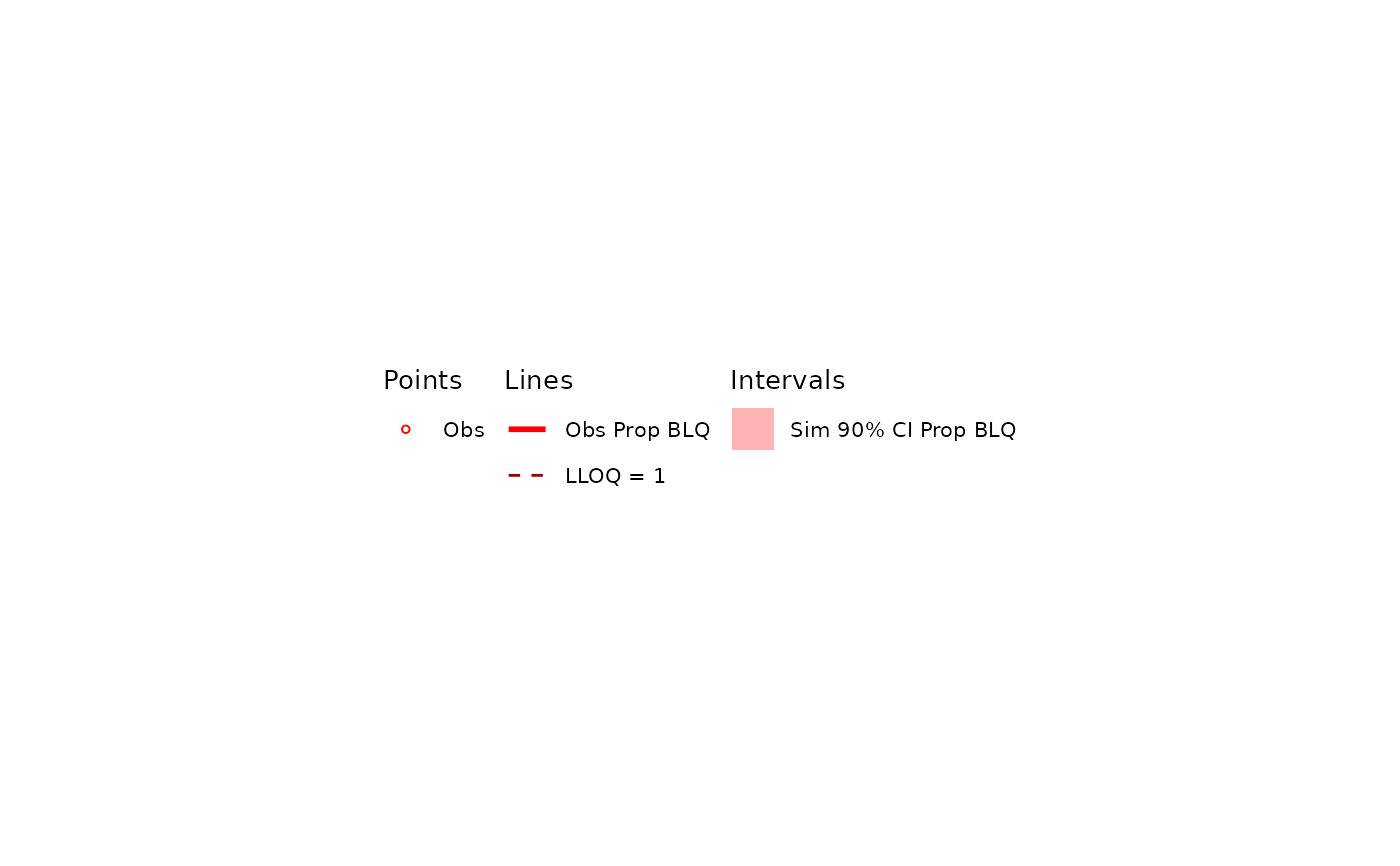 ## LLOQ entry without its value
plot_vpc_legend(loq = c(0.5, 1), show_loq_value = FALSE)
 ## ci, pi, and loq from a df_vpcstats() result
simout <- df_mrgsim_replicate(data = dplyr::filter(data_sad, CMT %in% c(1, 2)),
model = model_mread_load(model = "pkmodel"),
replicates = 10, dv_var = ODV)
#> Loading model from cache.
out <- df_vpcstats(simout, loq = 1, pi = c(0.1, 0.9))
plot_vpc_legend(stats = out)