Plotting an illness-death-model using plot.Hist.
plotIllnessDeathModel(stateLabels, style = 1, recovery = FALSE, ...)Arguments
See also
Examples
plotIllnessDeathModel()
#> Warning: The dimension of the boxes may depend on the current graphical device
#> in the sense that the layout and centering of text may change when you resize the graphical device and call the same plot.
 plotIllnessDeathModel(style=2)
#> Warning: The dimension of the boxes may depend on the current graphical device
#> in the sense that the layout and centering of text may change when you resize the graphical device and call the same plot.
plotIllnessDeathModel(style=2)
#> Warning: The dimension of the boxes may depend on the current graphical device
#> in the sense that the layout and centering of text may change when you resize the graphical device and call the same plot.
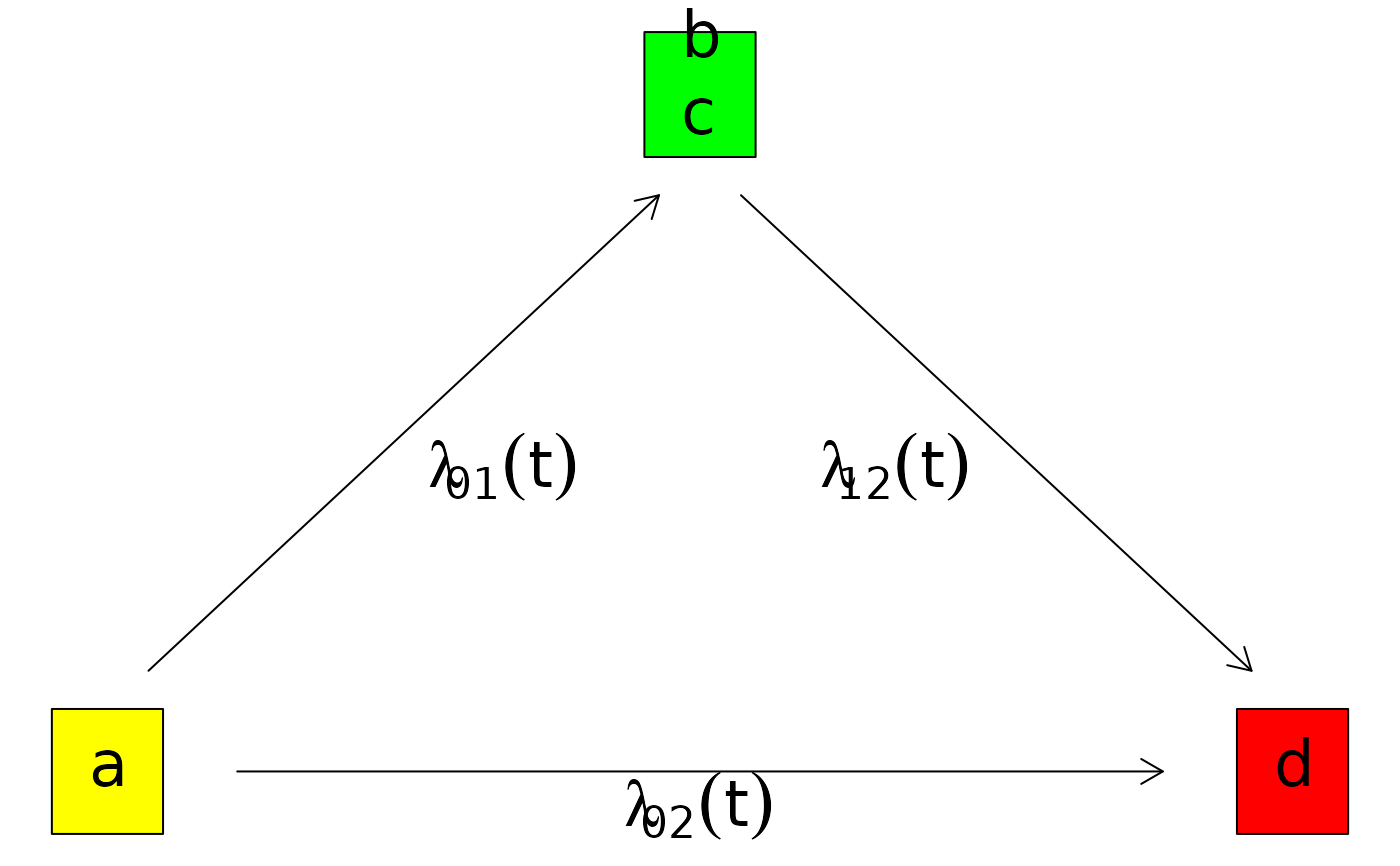
 plotIllnessDeathModel(style=2,
stateLabels=c("a","b\nc","d"),
box1.col="yellow",
box2.col="green",
box3.col="red")
#> Warning: The dimension of the boxes may depend on the current graphical device
#> in the sense that the layout and centering of text may change when you resize the graphical device and call the same plot.
plotIllnessDeathModel(style=2,
stateLabels=c("a","b\nc","d"),
box1.col="yellow",
box2.col="green",
box3.col="red")
#> Warning: The dimension of the boxes may depend on the current graphical device
#> in the sense that the layout and centering of text may change when you resize the graphical device and call the same plot.