Create a product plot
prodplot(
  data,
  formula,
  divider = mosaic(),
  cascade = 0,
  scale_max = TRUE,
  na.rm = FALSE,
  levels = -1L,
  ...
)
Arguments
- data
input data frame
- formula
formula specifying display of plot
- divider
divider function
- cascade
cascading amount, per nested layer
- scale_max
Logical vector of length 1. If
TRUEmaximum values within each nested layer will be scaled to take up all available space. IfFALSE, areas will be comparable between nested layers.- na.rm
Logical vector of length 1 - should missing levels be silently removed?
- levels
an integer vector specifying which levels to draw.
- ...
other arguments passed on to
draw
Examples
if (require("ggplot2")) {
prodplot(happy, ~ happy, "hbar")
prodplot(happy, ~ happy, "hspine")
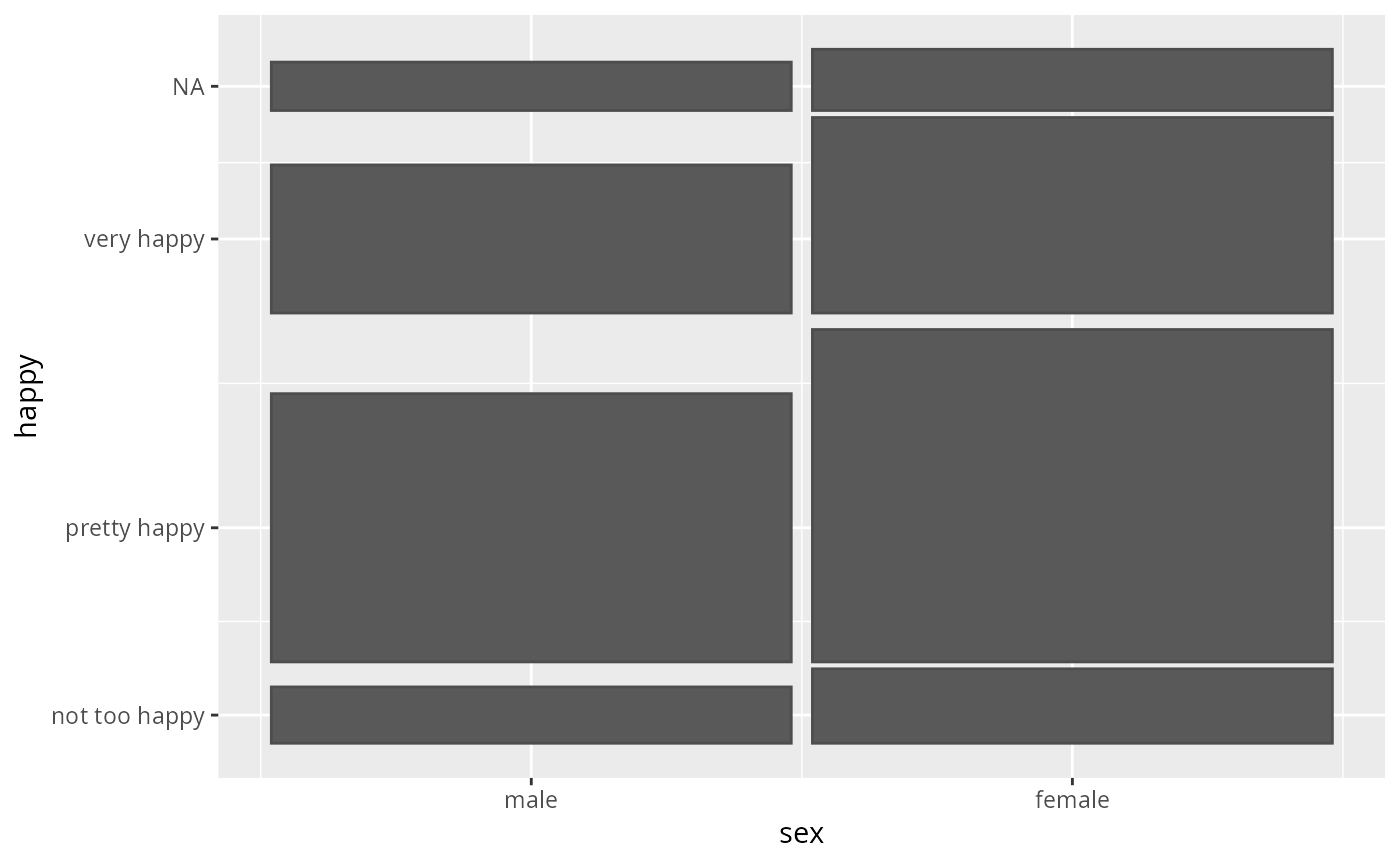
prodplot(happy, ~ sex + happy, c("vspine", "hbar"))
prodplot(happy, ~ sex + happy, stacked())
prodplot(happy, ~ happy + sex | health, mosaic("h")) + aes(fill=happy)
# The levels argument can be used to extract a given level of the plot
prodplot(happy, ~ sex + happy, stacked(), level = 1)
prodplot(happy, ~ sex + happy, stacked(), level = 2)
}
#> Loading required package: ggplot2
#> Warning: `aes_string()` was deprecated in ggplot2 3.0.0.
#> ℹ Please use tidy evaluation idioms with `aes()`.
#> ℹ See also `vignette("ggplot2-in-packages")` for more information.
#> ℹ The deprecated feature was likely used in the productplots package.
#> Please report the issue at <https://github.com/hadley/productplots/issues>.