Find Peaks and Valleys In A Series
peak.RdFunctions to find the peaks (tops) and valleys (bottoms) of a given series.
Value
A vector of integers corresponding to peaks/valleys.
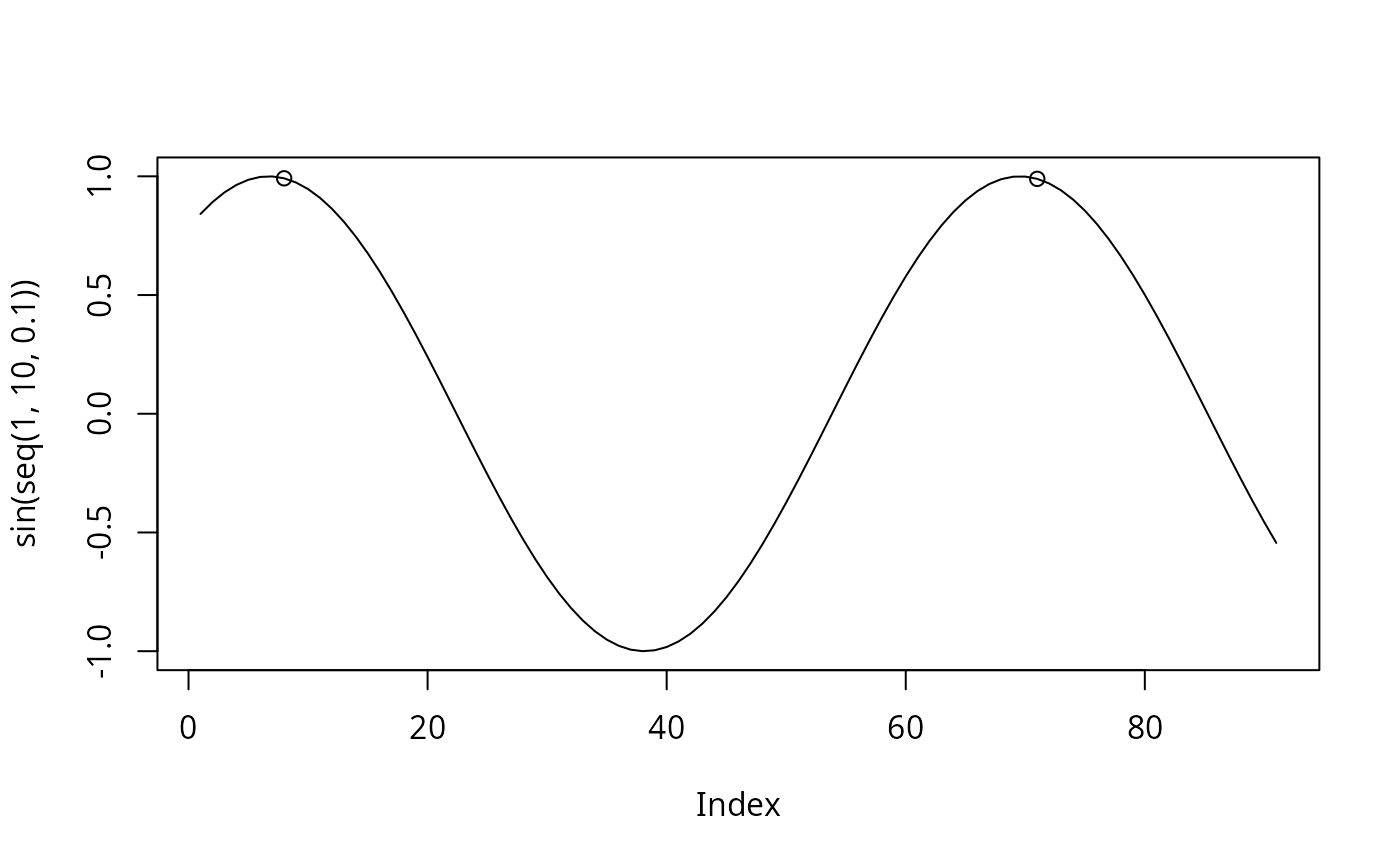
As a peak[valley] is defined as the highest[lowest] value in a series, the function can only define it after a change in direction has occurred. This means that the function will always return the first period after the peak/valley of the data, so as not to accidentally induce a look-ahead bias.