Tukey's Ladder of Powers
transformTukey.RdConducts Tukey's Ladder of Powers on a vector of values to produce a more-normally distributed vector of values.
Usage
transformTukey(
  x,
  start = -10,
  end = 10,
  int = 0.025,
  plotit = TRUE,
  verbose = FALSE,
  quiet = FALSE,
  statistic = 1,
  returnLambda = FALSE
)
Arguments
- x
A vector of values.
- start
The starting value of lambda to try.
- end
The ending value of lambda to try.
- int
The interval between lambda values to try.
- plotit
If
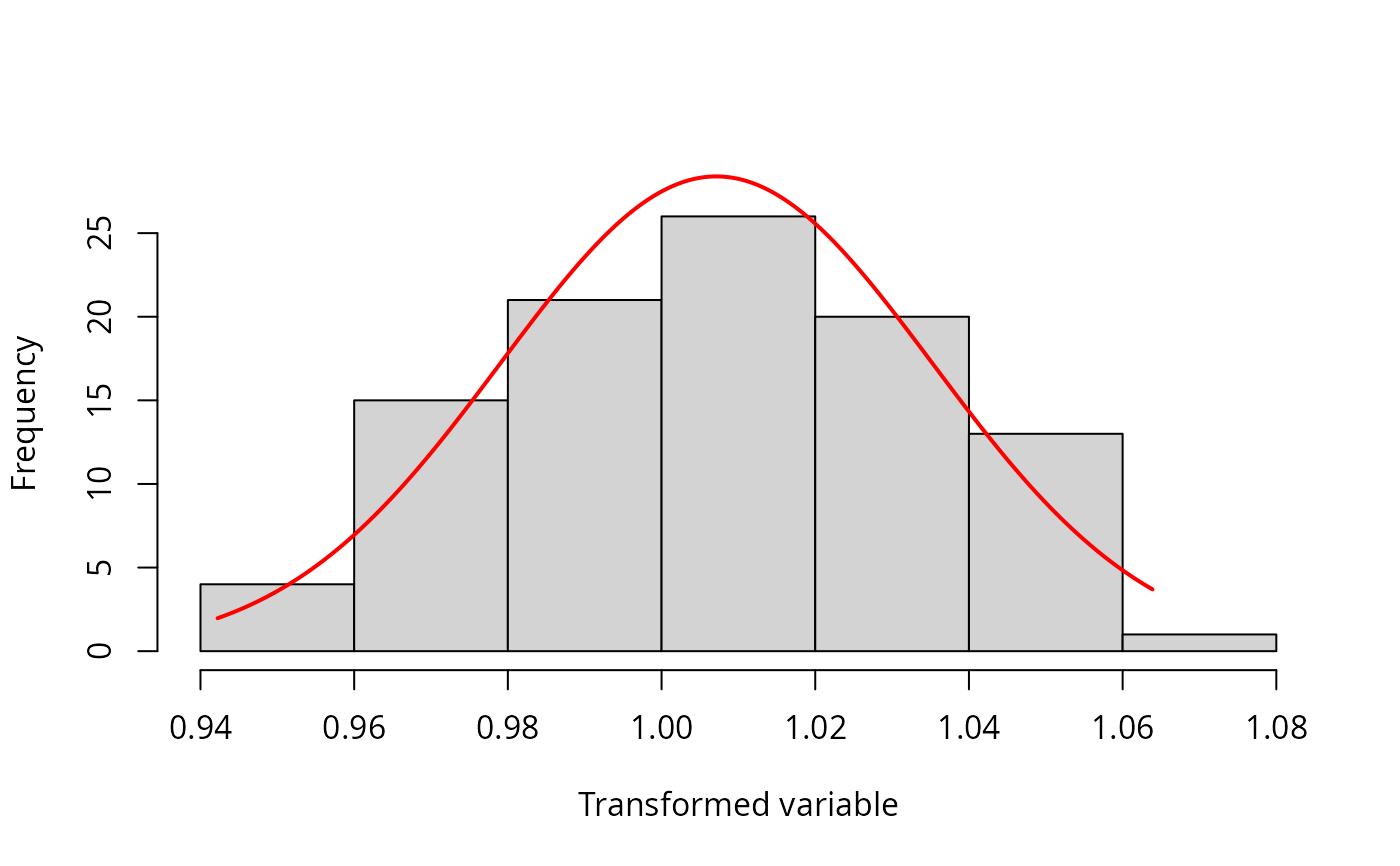
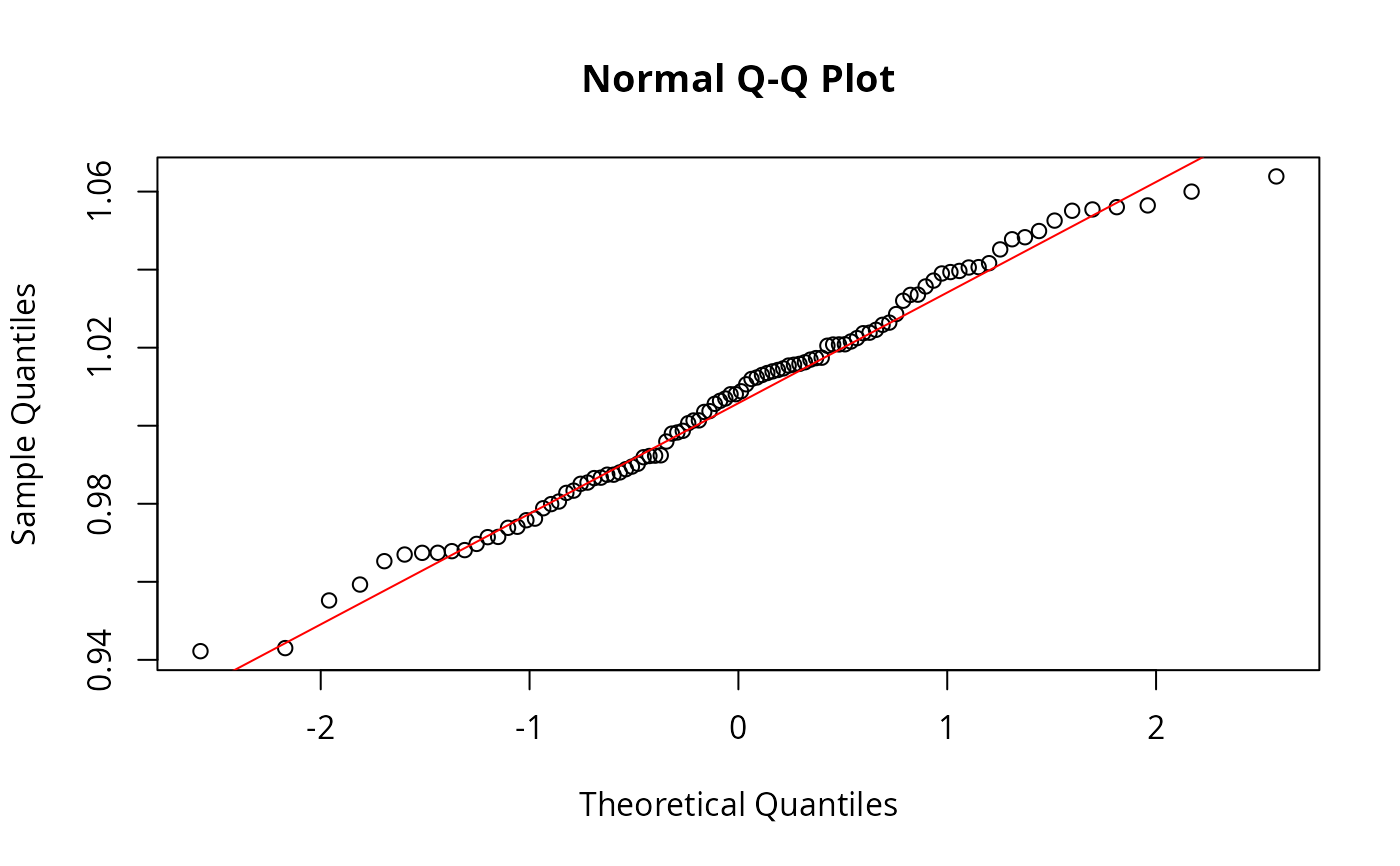
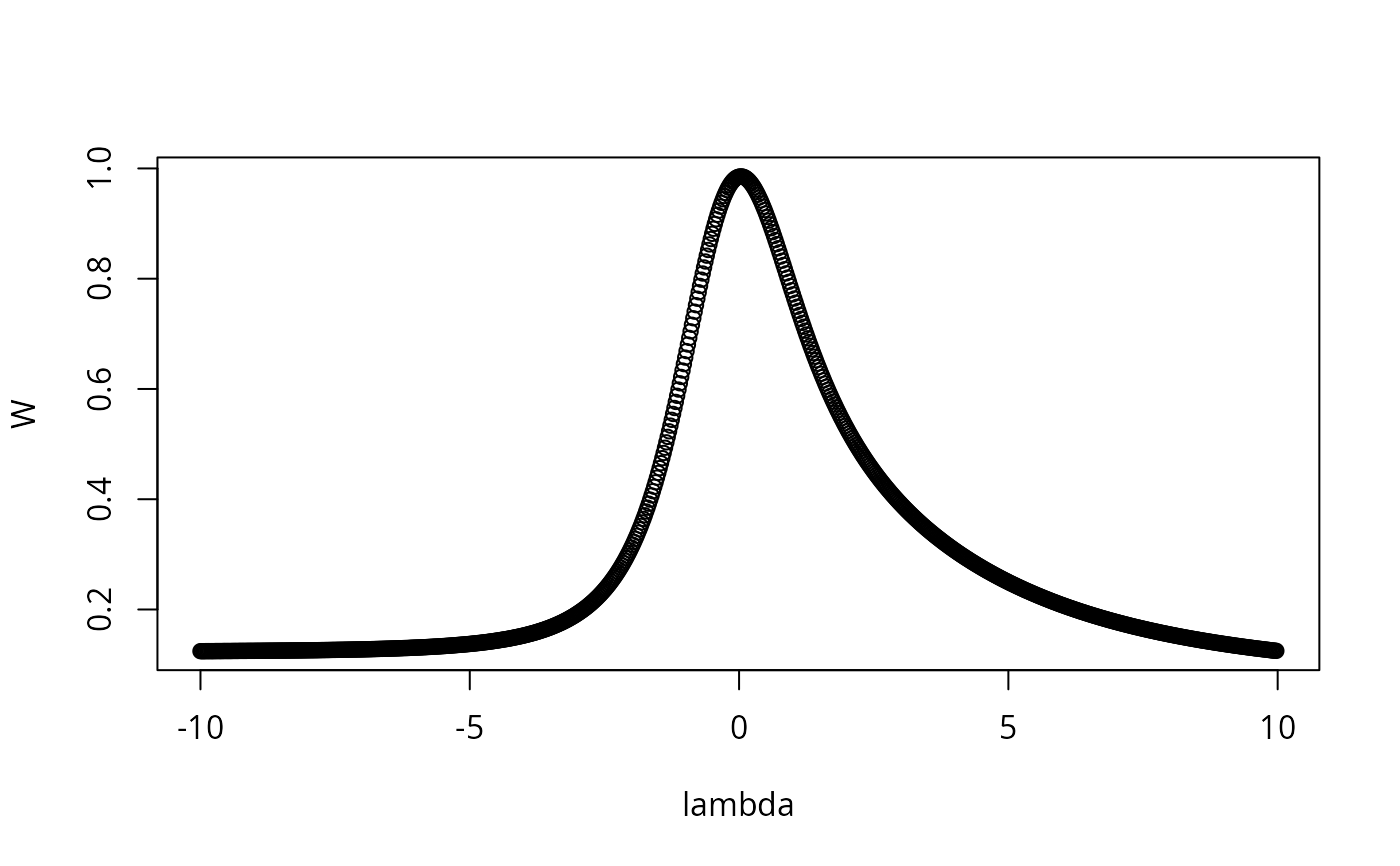
TRUE, produces plots of Shapiro-Wilks W or Anderson-Darling A vs. lambda, a histogram of transformed values, and a quantile-quantile plot of transformed values.- verbose
If
TRUE, prints extra output for Shapiro-Wilks W or Anderson-Darling A vs. lambda.- quiet
If
TRUE, doesn't print any output to the screen.- statistic
If
1, uses Shapiro-Wilks test. Will reportNAif the sample size is greater than 5000. If2, uses Anderson-Darling test.- returnLambda
If
TRUE, returns only the lambda value, not the vector of transformed values.
Details
The function simply loops through lamdba values from start
to end at an interval of int.
The function then chooses the lambda which maximizes the Shapiro-Wilks W statistic or minimizes the Anderson-Darling A statistic.
It may be beneficial to add a constant to the input vector so that all values are posititive. For left-skewed data, a (Constant - X) transformation may be helpful. Large values may need to be scaled.
Author
Salvatore Mangiafico, mangiafico@njaes.rutgers.edu
Examples
### Log-normal distribution example
Conc = rlnorm(100)
Conc.trans = transformTukey(Conc)

#>
#>     lambda      W Shapiro.p.value
#> 402  0.025 0.9855          0.3452
#>
#> if (lambda >  0){TRANS = x ^ lambda}
#> if (lambda == 0){TRANS = log(x)}
#> if (lambda <  0){TRANS = -1 * x ^ lambda}
#>
#>
#> lambda W Shapiro.p.value
#> 402 0.025 0.9855 0.3452
#>
#> if (lambda > 0){TRANS = x ^ lambda}
#> if (lambda == 0){TRANS = log(x)}
#> if (lambda < 0){TRANS = -1 * x ^ lambda}
#>