Phosphorus Content Data
phosphor.RdThis dataset investigates the effect from inorganic and organic Phosphorus in the soil upon the phosphorus content of the corn grown in this soil, from Prescott (1975).
data(phosphor, package="robustbase")Format
A data frame with 18 observations on the following 3 variables.
inorgInorganic soil Phosphorus
organicOrganic soil Phosphorus
plantPlant Phosphorus content
Source
P. J. Rousseeuw and A. M. Leroy (1987) Robust Regression and Outlier Detection. Wiley, p.156, table 24.
Examples
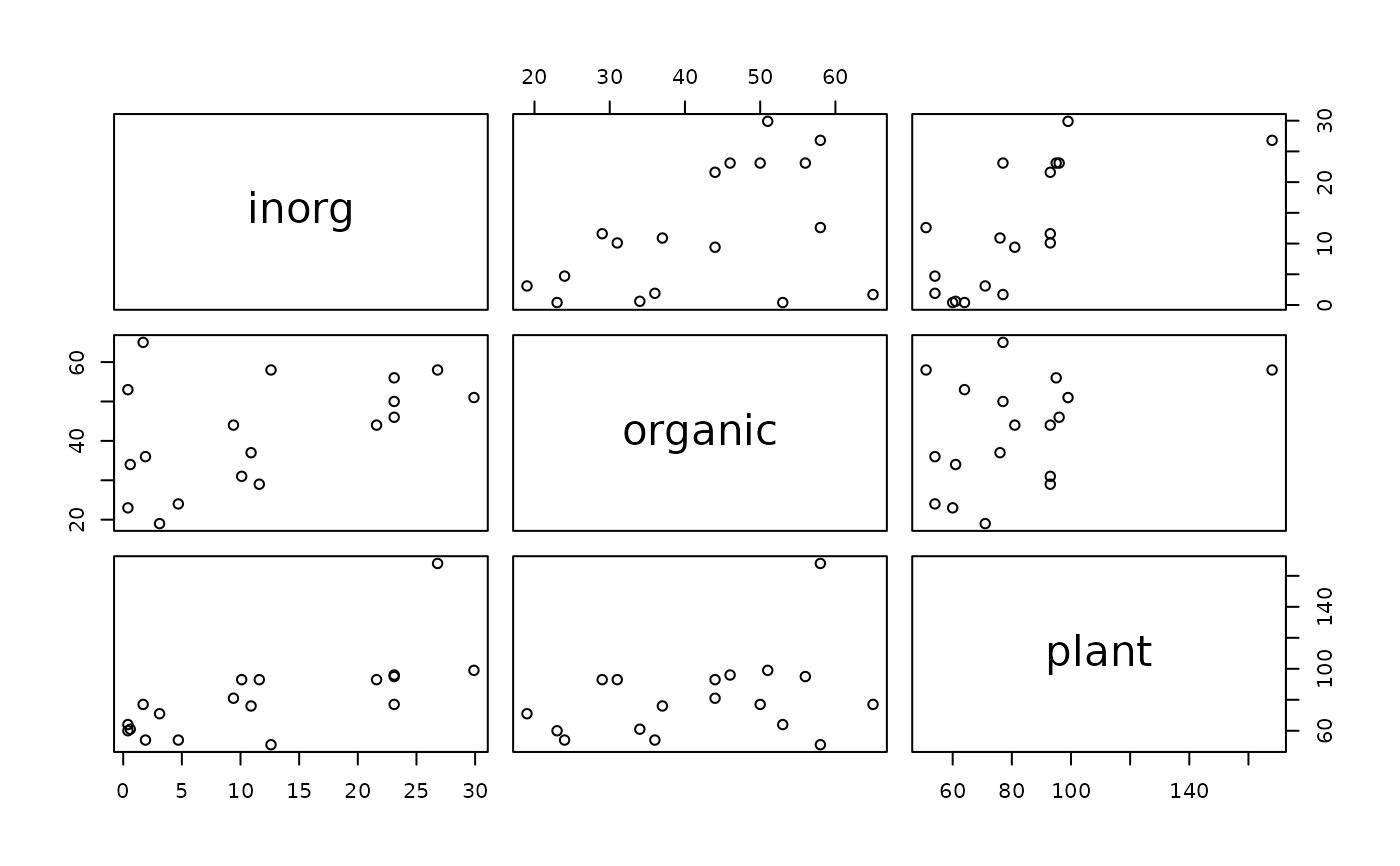
data(phosphor)
plot(phosphor)
 summary(lm.phosphor <- lm(plant ~ ., data = phosphor))
#>
#> Call:
#> lm(formula = plant ~ ., data = phosphor)
#>
#> Residuals:
#> Min 1Q Median 3Q Max
#> -32.828 -8.440 -1.118 6.694 58.757
#>
#> Coefficients:
#> Estimate Std. Error t value Pr(>|t|)
#> (Intercept) 56.25102 16.31074 3.449 0.00358 **
#> inorg 1.78977 0.55674 3.215 0.00579 **
#> organic 0.08665 0.41494 0.209 0.83740
#> ---
#> Signif. codes: 0 ‘***’ 0.001 ‘**’ 0.01 ‘*’ 0.05 ‘.’ 0.1 ‘ ’ 1
#>
#> Residual standard error: 20.68 on 15 degrees of freedom
#> Multiple R-squared: 0.4823, Adjusted R-squared: 0.4133
#> F-statistic: 6.988 on 2 and 15 DF, p-value: 0.00717
#>
summary(lts.phosphor <- ltsReg(plant ~ ., data = phosphor))
#>
#> Call:
#> ltsReg.formula(formula = plant ~ ., data = phosphor)
#>
#> Residuals (from reweighted LS):
#> Min 1Q Median 3Q Max
#> -30.2967 -3.5911 -0.6916 4.2514 17.1156
#>
#> Coefficients:
#> Estimate Std. Error t value Pr(>|t|)
#> Intercept 60.91489 10.19950 5.972 3.41e-05 ***
#> inorg 1.21103 0.35494 3.412 0.00421 **
#> organic 0.08833 0.25742 0.343 0.73661
#> ---
#> Signif. codes: 0 ‘***’ 0.001 ‘**’ 0.01 ‘*’ 0.05 ‘.’ 0.1 ‘ ’ 1
#>
#> Residual standard error: 12.69 on 14 degrees of freedom
#> Multiple R-Squared: 0.5188, Adjusted R-squared: 0.4501
#> F-statistic: 7.548 on 2 and 14 DF, p-value: 0.005972
#>
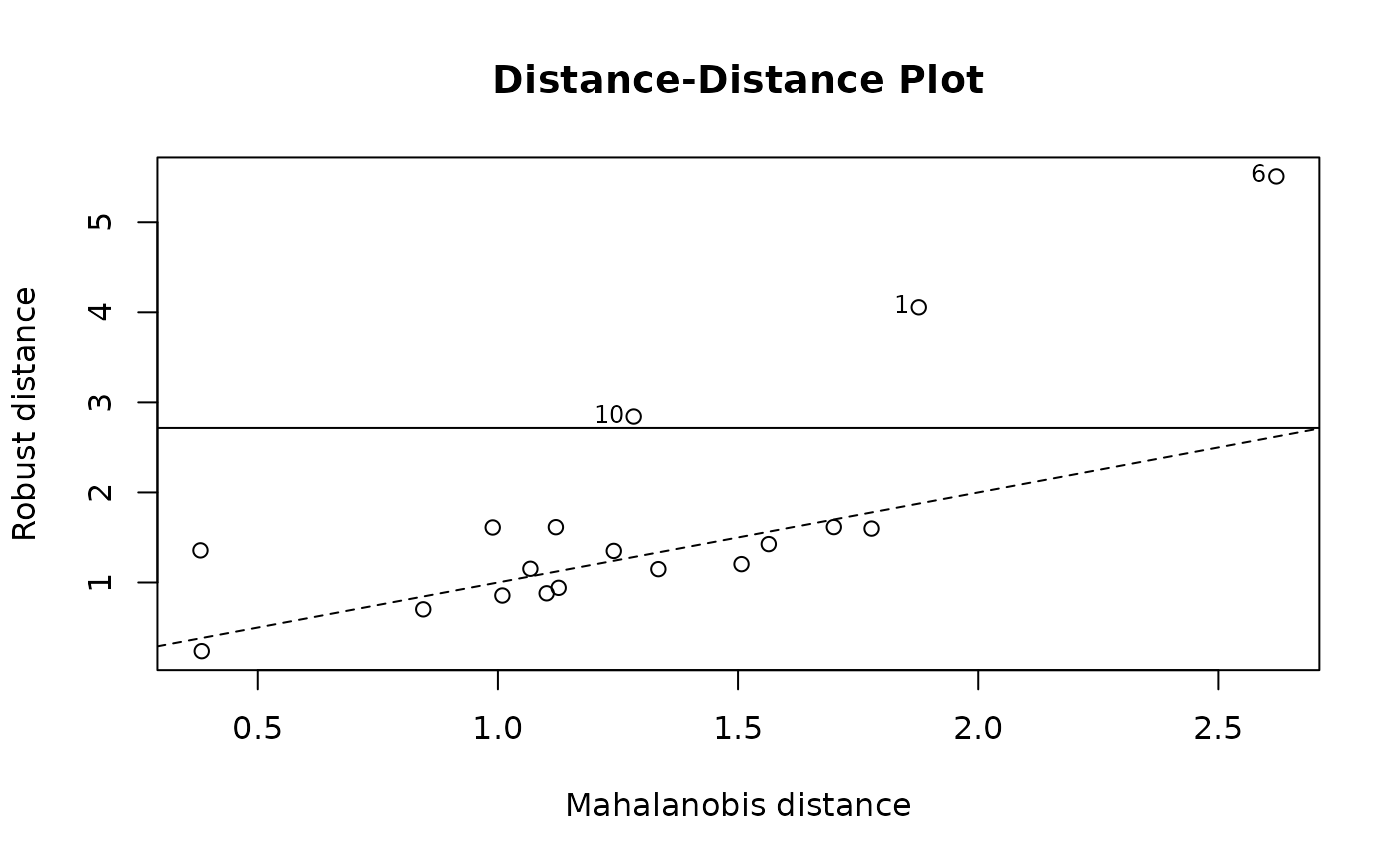
phosphor.x <- data.matrix(phosphor[, 1:2])
cPh <- covMcd(phosphor.x)
plot(cPh, "dd")
summary(lm.phosphor <- lm(plant ~ ., data = phosphor))
#>
#> Call:
#> lm(formula = plant ~ ., data = phosphor)
#>
#> Residuals:
#> Min 1Q Median 3Q Max
#> -32.828 -8.440 -1.118 6.694 58.757
#>
#> Coefficients:
#> Estimate Std. Error t value Pr(>|t|)
#> (Intercept) 56.25102 16.31074 3.449 0.00358 **
#> inorg 1.78977 0.55674 3.215 0.00579 **
#> organic 0.08665 0.41494 0.209 0.83740
#> ---
#> Signif. codes: 0 ‘***’ 0.001 ‘**’ 0.01 ‘*’ 0.05 ‘.’ 0.1 ‘ ’ 1
#>
#> Residual standard error: 20.68 on 15 degrees of freedom
#> Multiple R-squared: 0.4823, Adjusted R-squared: 0.4133
#> F-statistic: 6.988 on 2 and 15 DF, p-value: 0.00717
#>
summary(lts.phosphor <- ltsReg(plant ~ ., data = phosphor))
#>
#> Call:
#> ltsReg.formula(formula = plant ~ ., data = phosphor)
#>
#> Residuals (from reweighted LS):
#> Min 1Q Median 3Q Max
#> -30.2967 -3.5911 -0.6916 4.2514 17.1156
#>
#> Coefficients:
#> Estimate Std. Error t value Pr(>|t|)
#> Intercept 60.91489 10.19950 5.972 3.41e-05 ***
#> inorg 1.21103 0.35494 3.412 0.00421 **
#> organic 0.08833 0.25742 0.343 0.73661
#> ---
#> Signif. codes: 0 ‘***’ 0.001 ‘**’ 0.01 ‘*’ 0.05 ‘.’ 0.1 ‘ ’ 1
#>
#> Residual standard error: 12.69 on 14 degrees of freedom
#> Multiple R-Squared: 0.5188, Adjusted R-squared: 0.4501
#> F-statistic: 7.548 on 2 and 14 DF, p-value: 0.005972
#>
phosphor.x <- data.matrix(phosphor[, 1:2])
cPh <- covMcd(phosphor.x)
plot(cPh, "dd")