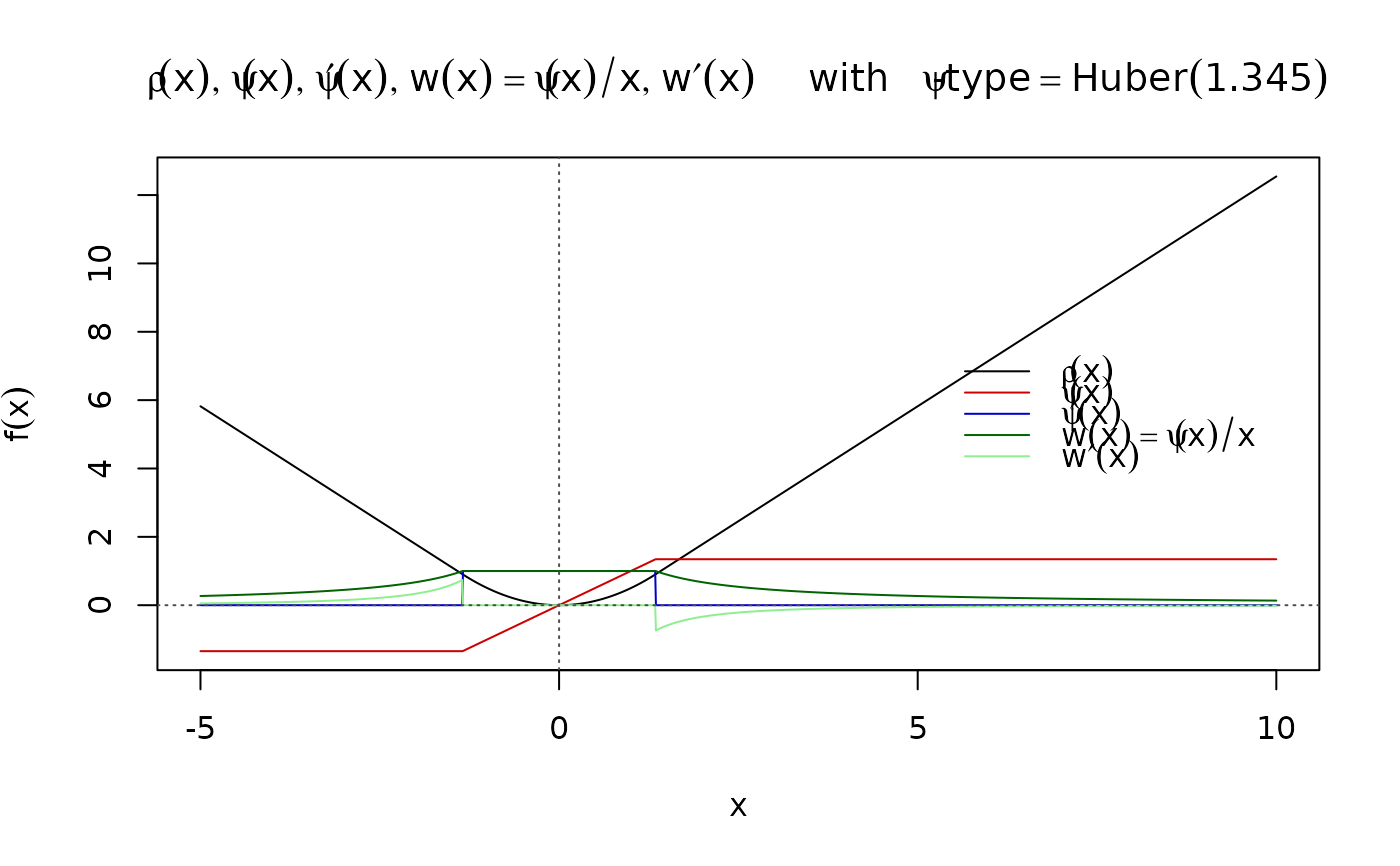
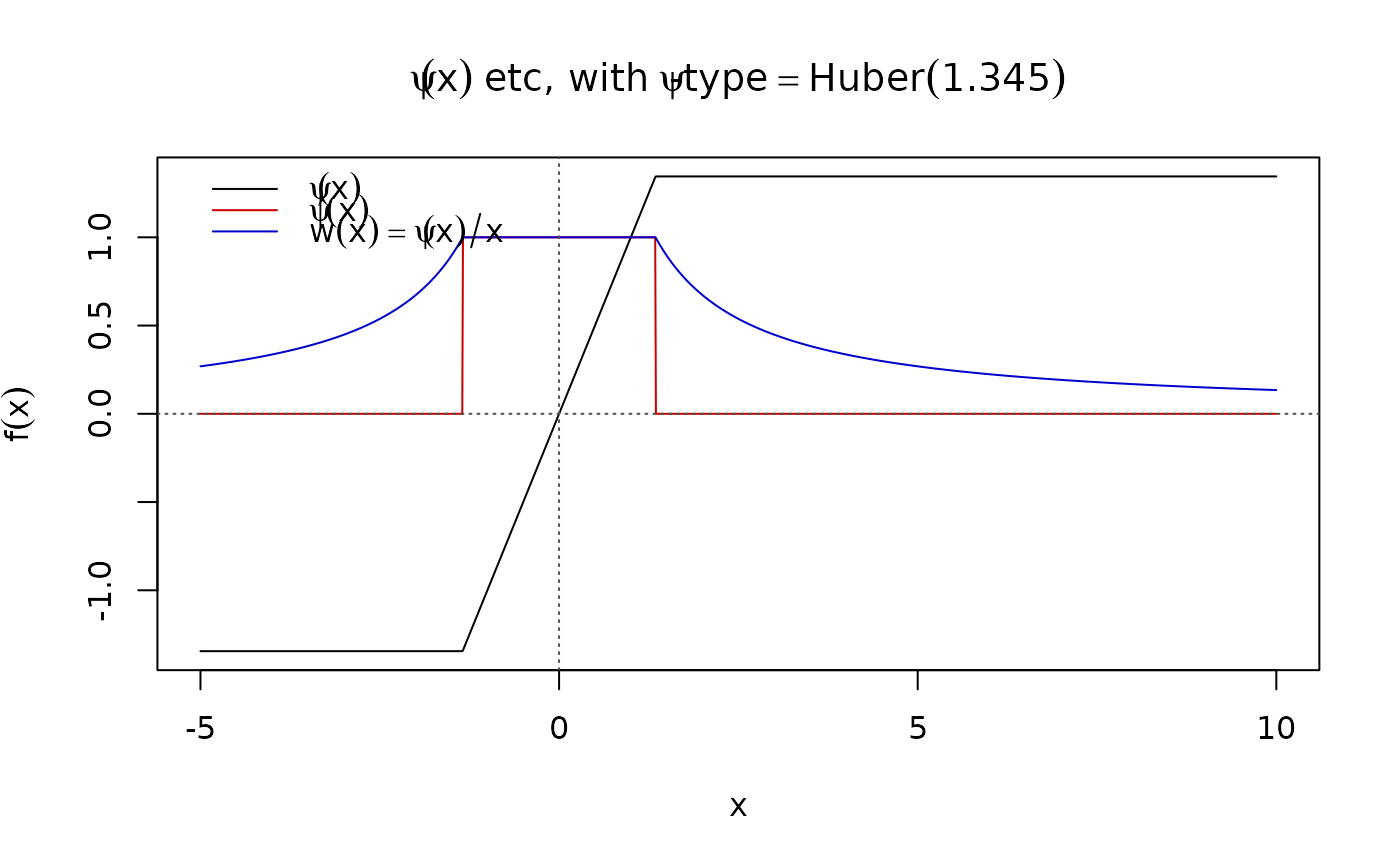
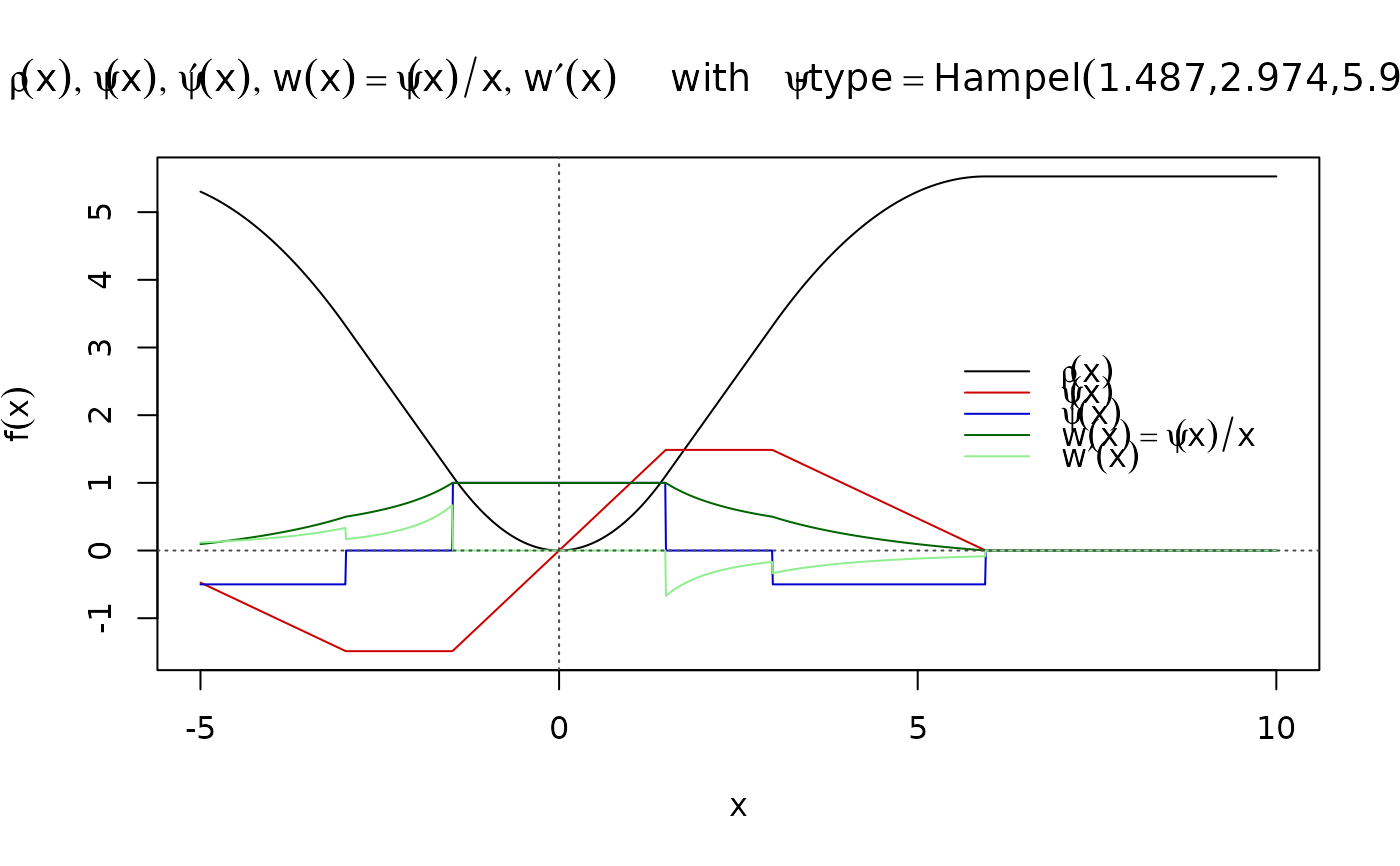
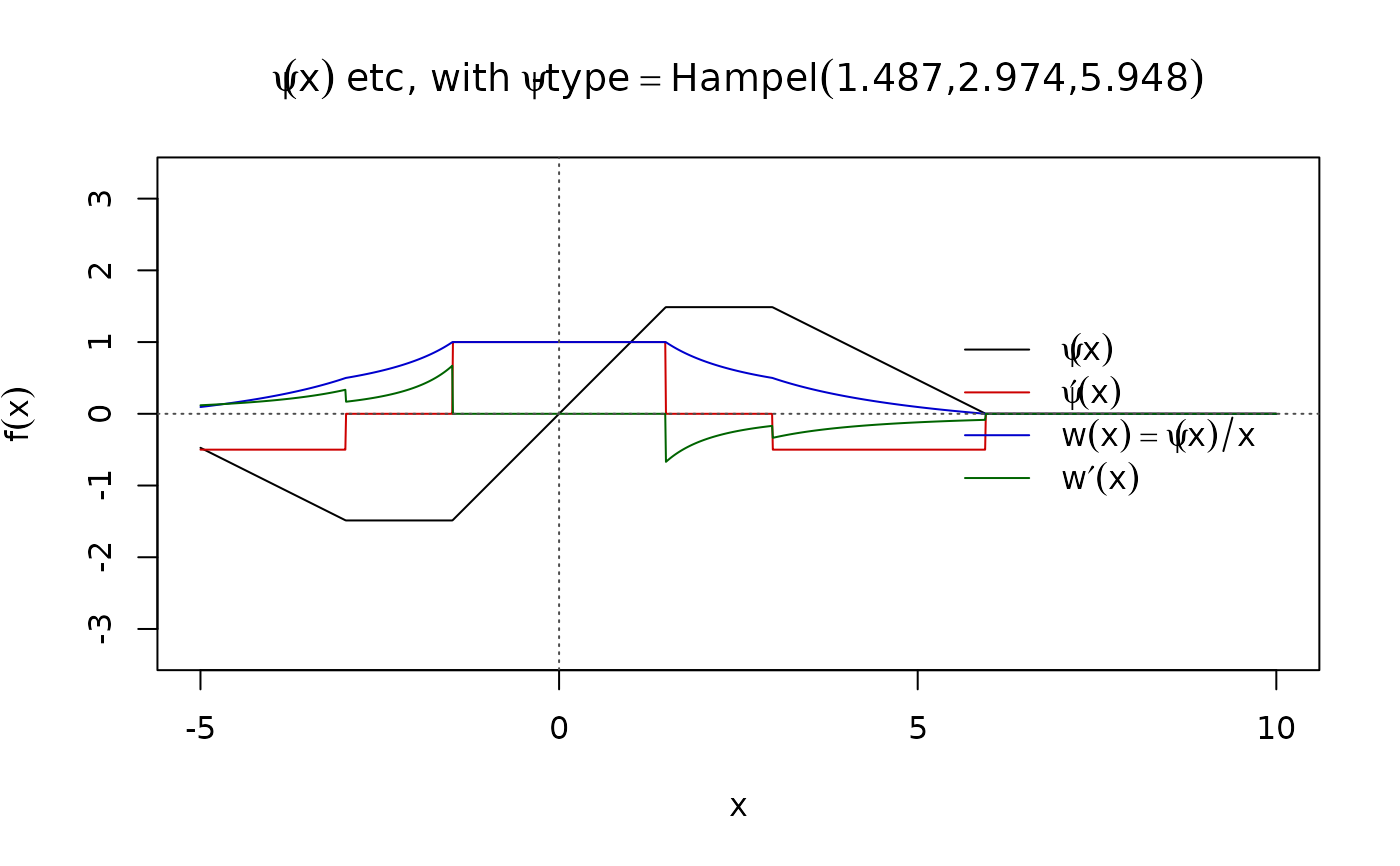
Plot an Object of the "Psi Function" Class
plot-methods.RdThe plot method objects of class
psi_func simply visualizes the
\(\rho()\), \(\psi()\), and weight functions and their
derivatives.
# S4 method for class 'psi_func'
plot(x, y,
     which = c("rho", "psi", "Dpsi", "wgt", "Dwgt"),
     main = "full", <!-- % shortMain = FALSE, -->
     col = c("black", "red3", "blue3", "dark green", "light green"),
     leg.loc = "right", ...)
Arguments
- x
object of class
psi_functo be plotted- y
(optional) vector of abscissa values (to plot object at).
- which
charactervector of slots to be included in plot; by default, all of the slots are included- main
string or logical indicating the kind of plot title; either
"full","short"orFALSEwhich chooses a full, a short or no main title at all.
Note
An earlier version had argument shortMain which is deprecated
now. Use main = "short" instead of shortMain = TRUE.
If you want to specify your own title, use main=FALSE, and a
subsequent title(...) call.