Hertzsprung-Russell Diagram Data of Star Cluster CYG OB1
starsCYG.RdData for the Hertzsprung-Russell Diagram of the Star Cluster CYG OB1, which contains 47 stars in the direction of Cygnus, from C.Doom. The first variable is the logarithm of the effective temperature at the surface of the star (Te) and the second one is the logarithm of its light intencity (\(L/L_0\)).
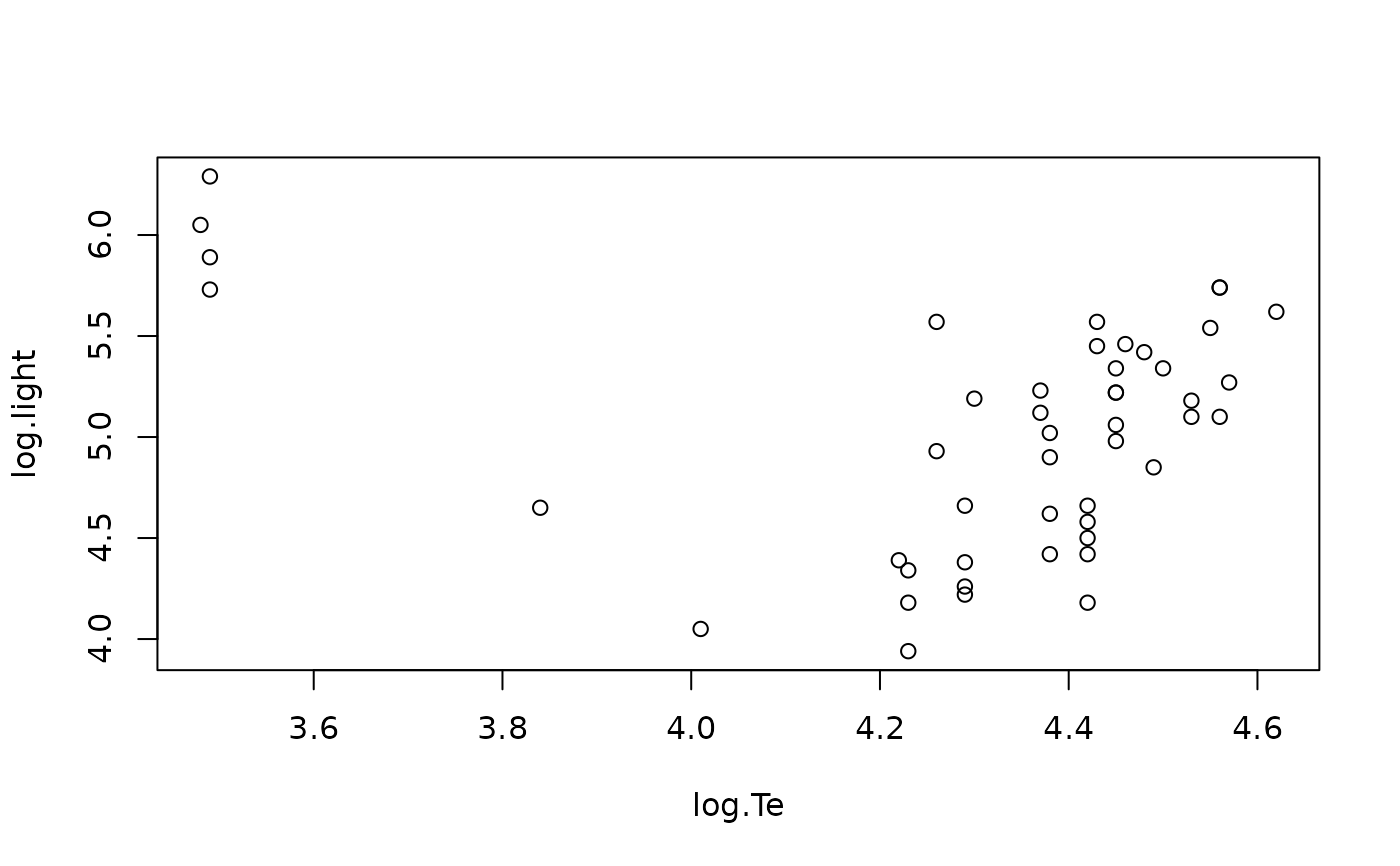
In the Hertzsprung-Russell diagram, which is the scatterplot of these
data points, where the log temperature is plotted from left to right,
two groups of points are seen:
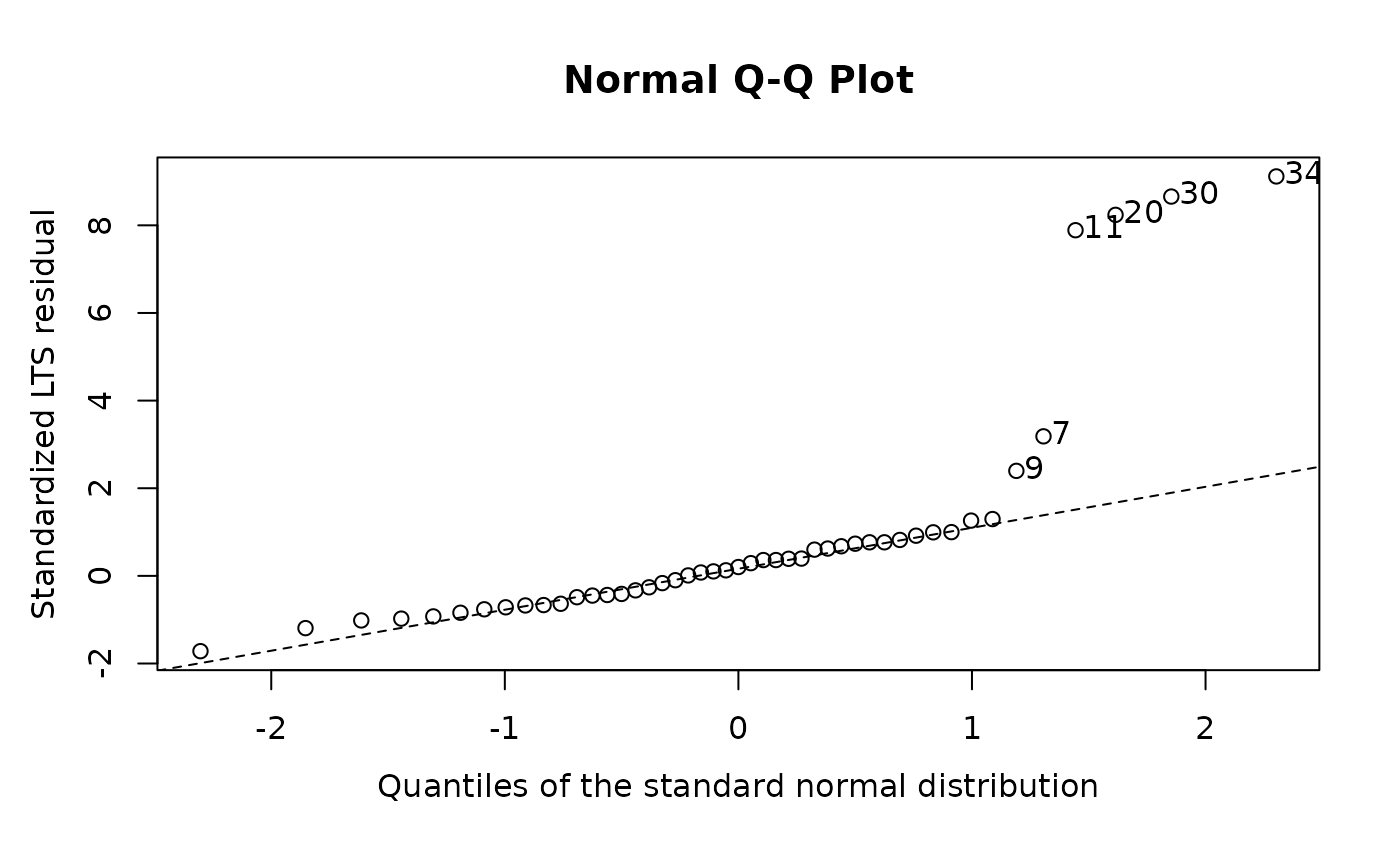
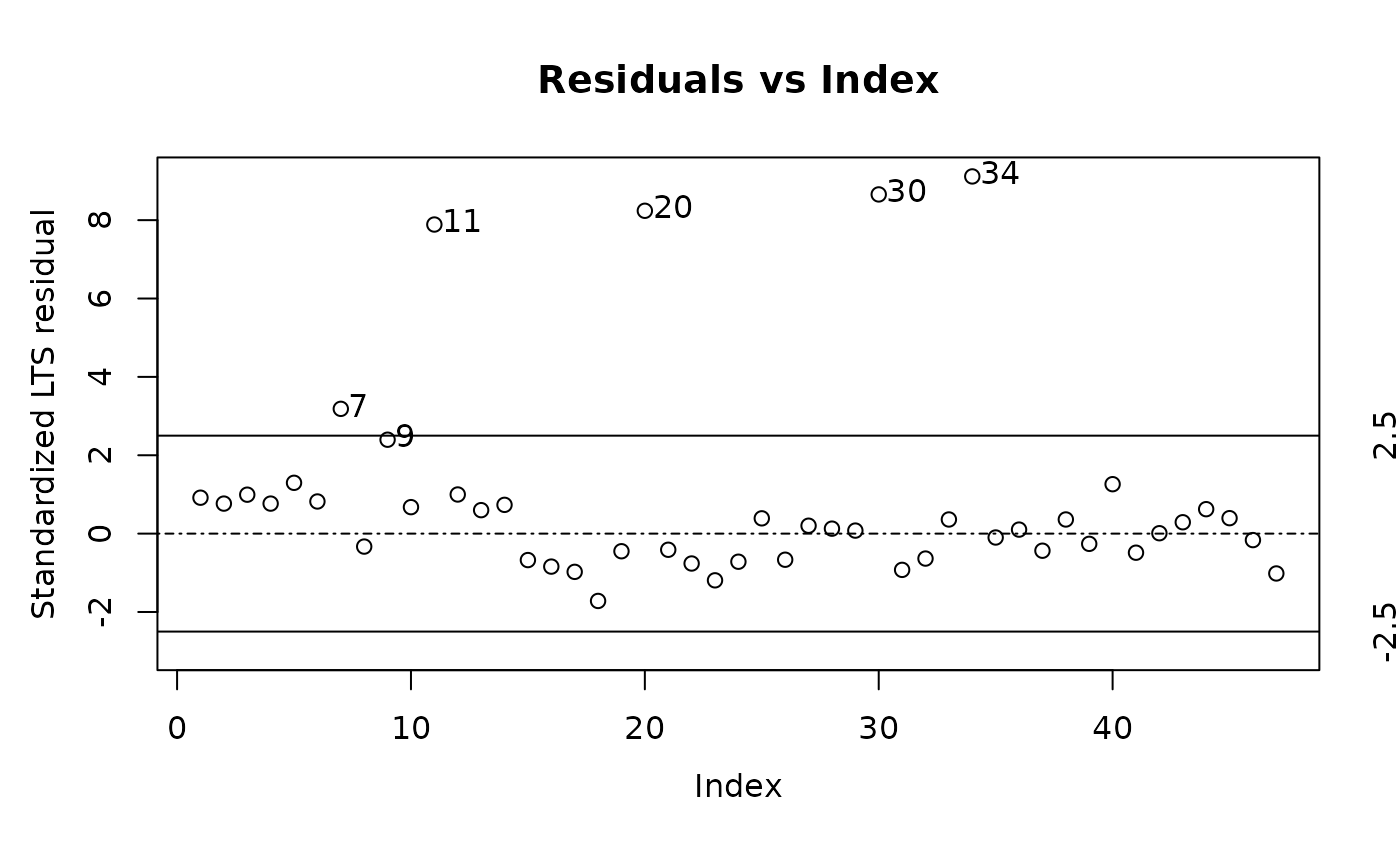
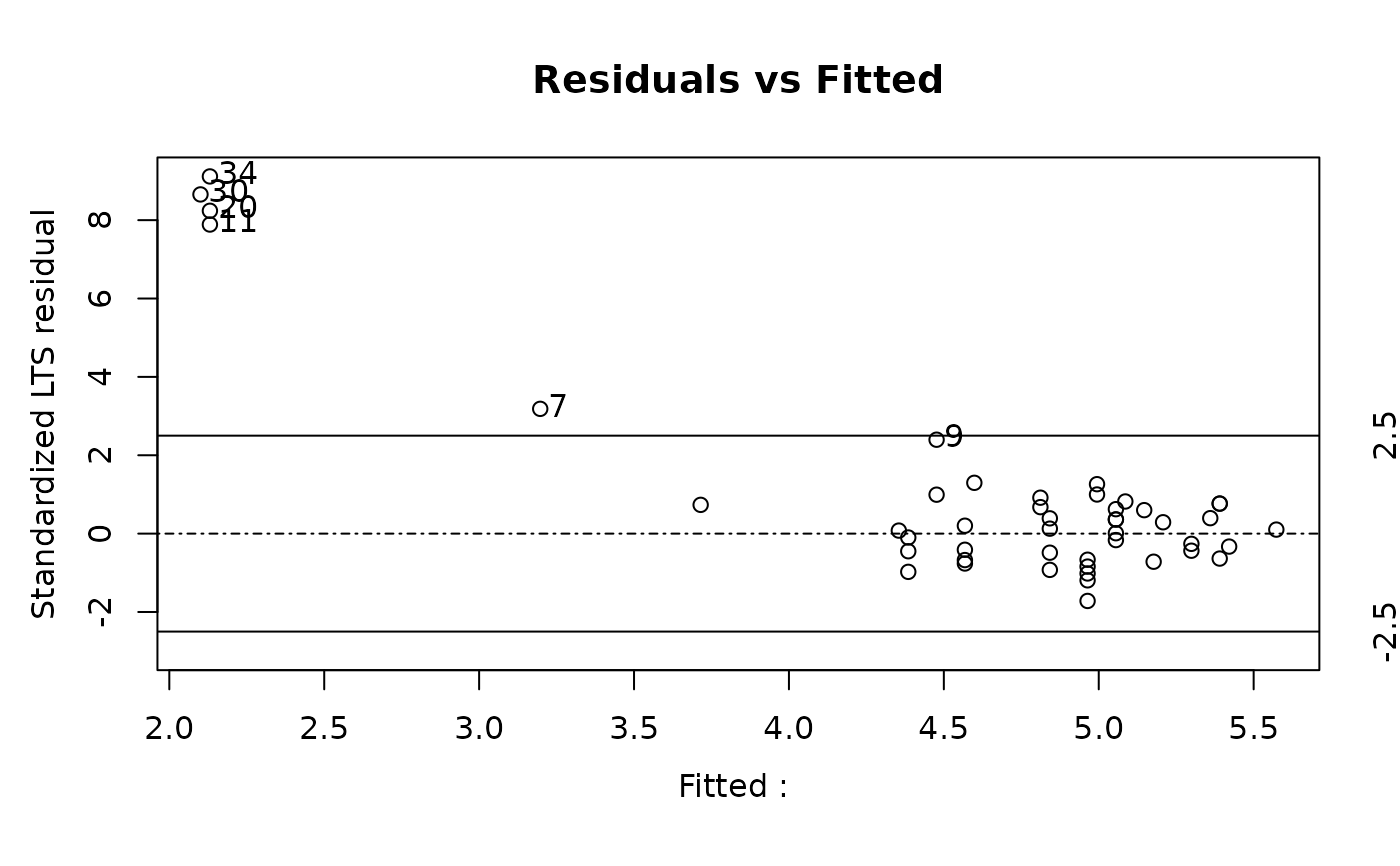
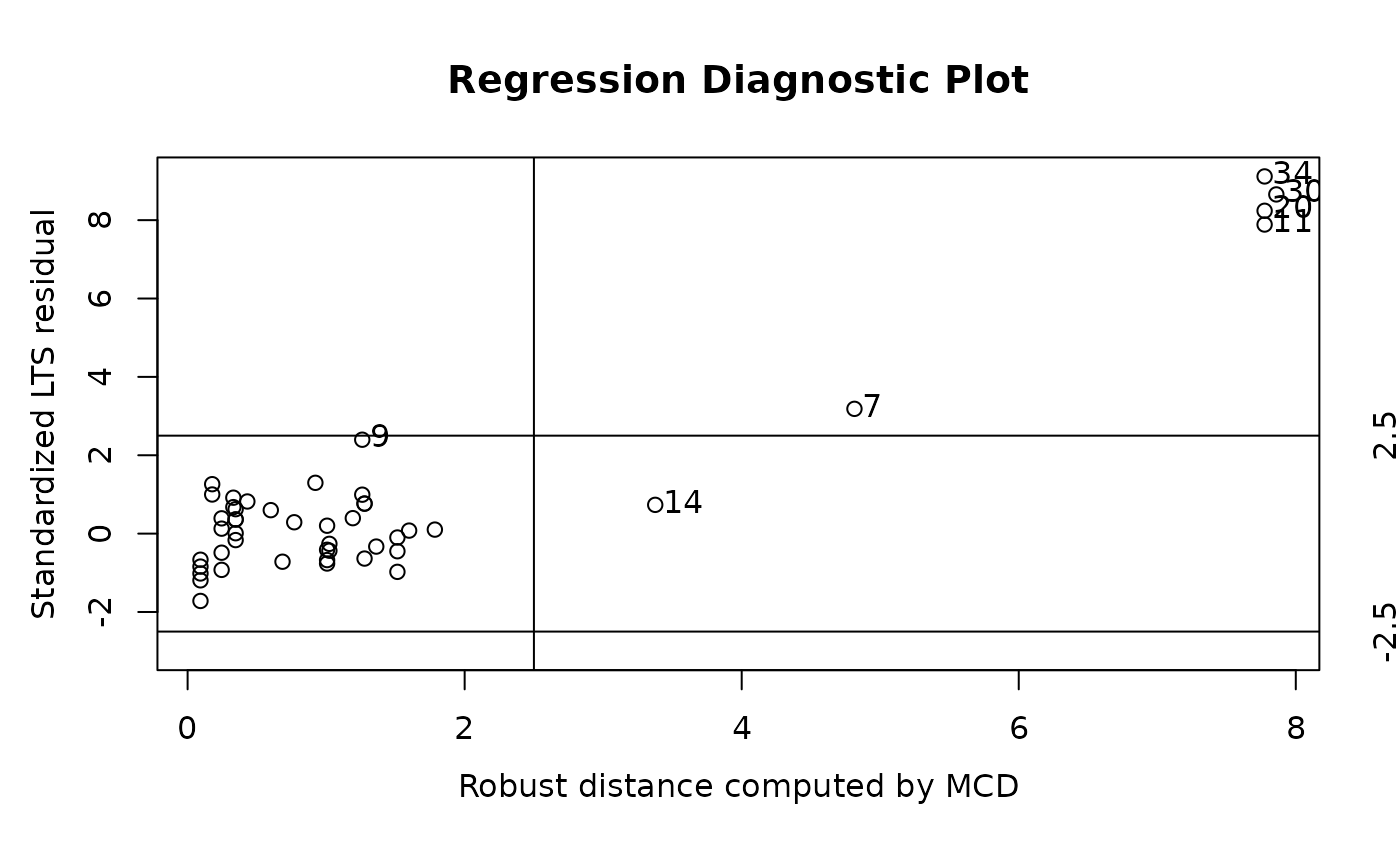
the majority which tend to follow a steep band and four stars in the
upper corner. In the astronomy the 43 stars are said to lie on the
main sequence and the four remaining stars are called “giants” (the
points 11, 20, 30, 34).
data(starsCYG, package="robustbase")Format
A data frame with 47 observations on the following 2 variables
log.TeLogarithm of the effective temperature at the surface of the star (Te).
log.lightLogarithm of its light intencity (\(L/L_0\))
Source
P. J. Rousseeuw and A. M. Leroy (1987) Robust Regression and Outlier Detection; Wiley, p.27, table 3.
Examples
data(starsCYG)
plot(starsCYG)
 cst <- covMcd(starsCYG)
lm.stars <- lm(log.light ~ log.Te, data = starsCYG)
summary(lm.stars)
#>
#> Call:
#> lm(formula = log.light ~ log.Te, data = starsCYG)
#>
#> Residuals:
#> Min 1Q Median 3Q Max
#> -1.1052 -0.5067 0.1327 0.4423 0.9390
#>
#> Coefficients:
#> Estimate Std. Error t value Pr(>|t|)
#> (Intercept) 6.7935 1.2365 5.494 1.75e-06 ***
#> log.Te -0.4133 0.2863 -1.444 0.156
#> ---
#> Signif. codes: 0 ‘***’ 0.001 ‘**’ 0.01 ‘*’ 0.05 ‘.’ 0.1 ‘ ’ 1
#>
#> Residual standard error: 0.5646 on 45 degrees of freedom
#> Multiple R-squared: 0.04427, Adjusted R-squared: 0.02304
#> F-statistic: 2.085 on 1 and 45 DF, p-value: 0.1557
#>
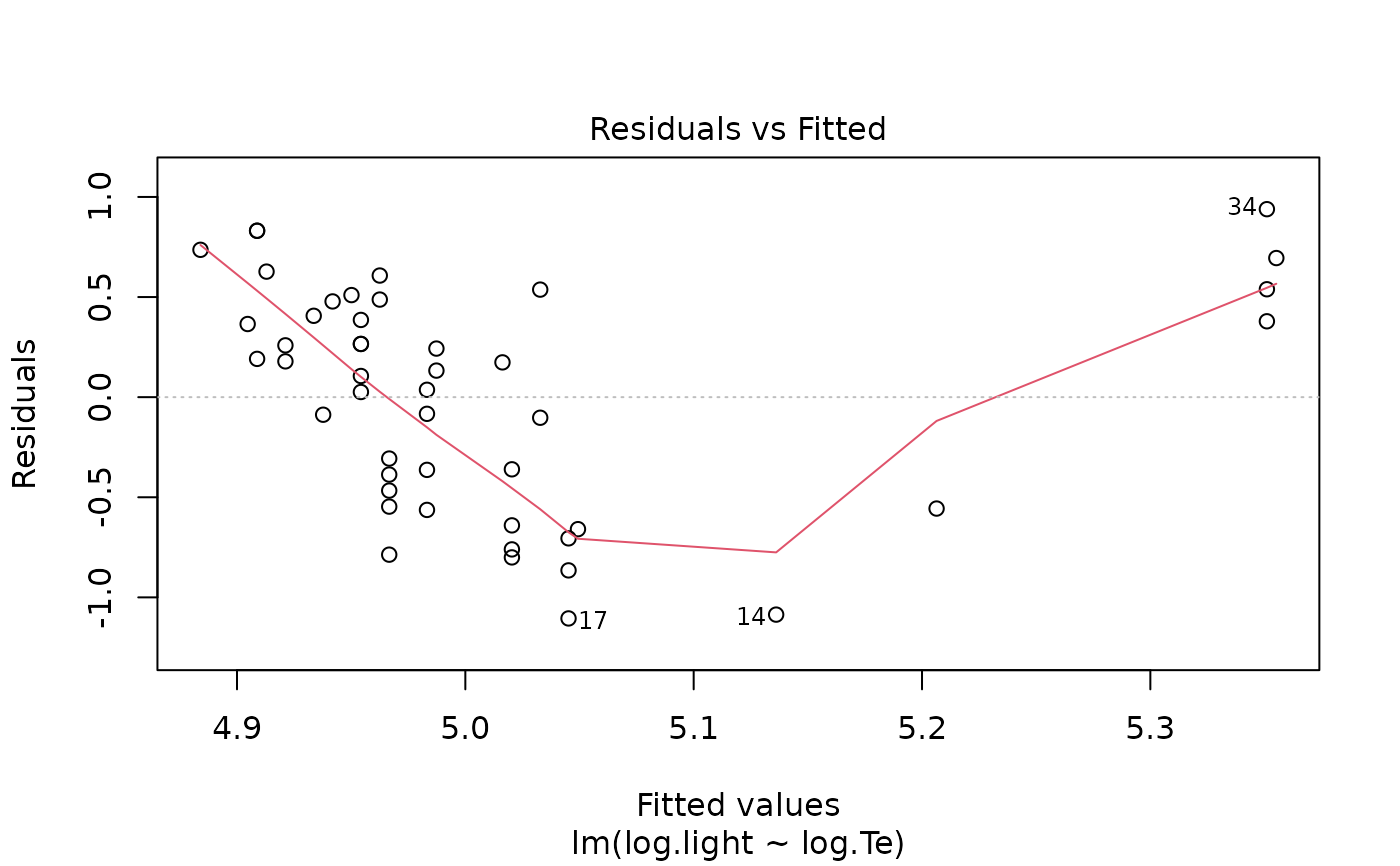
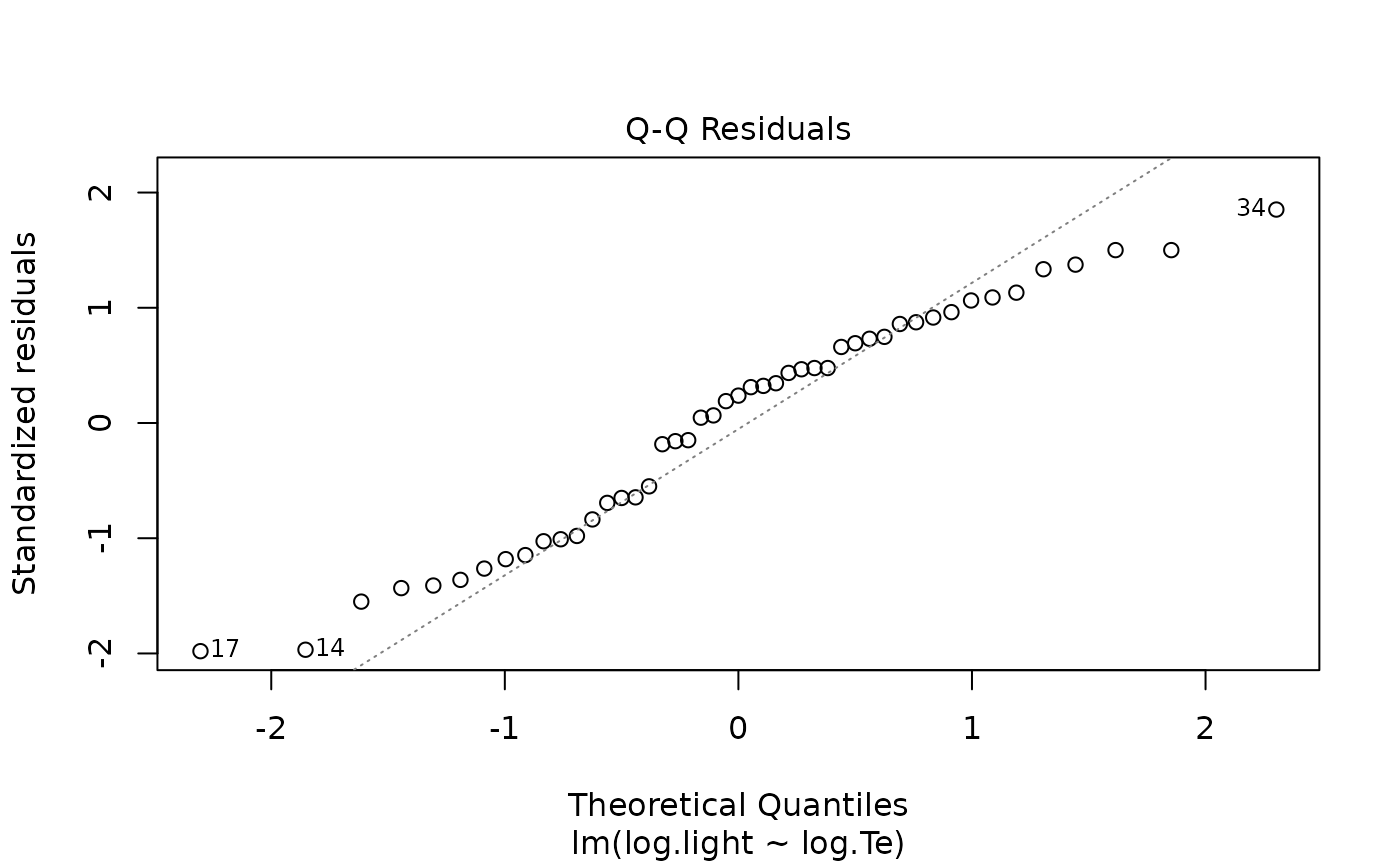
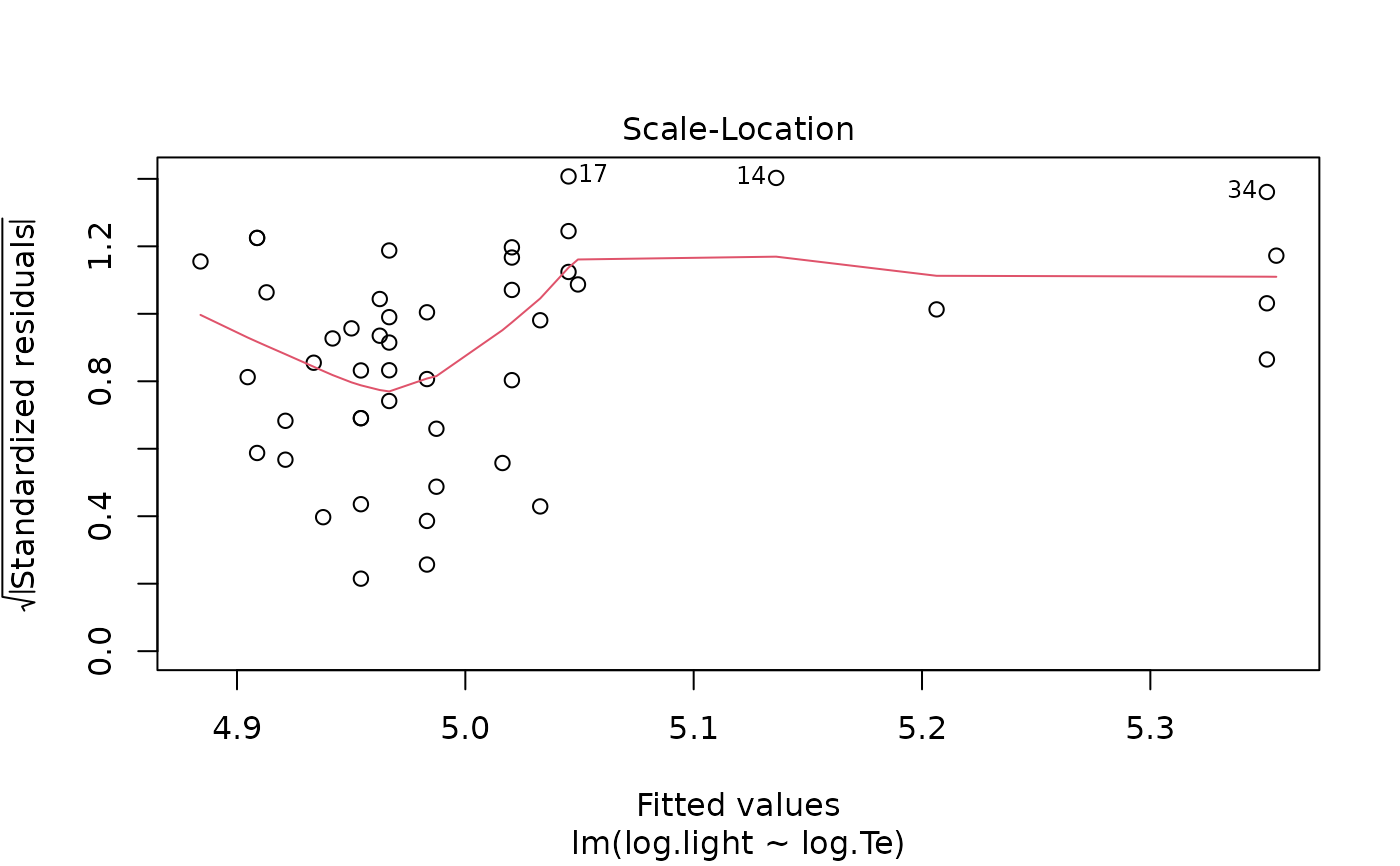
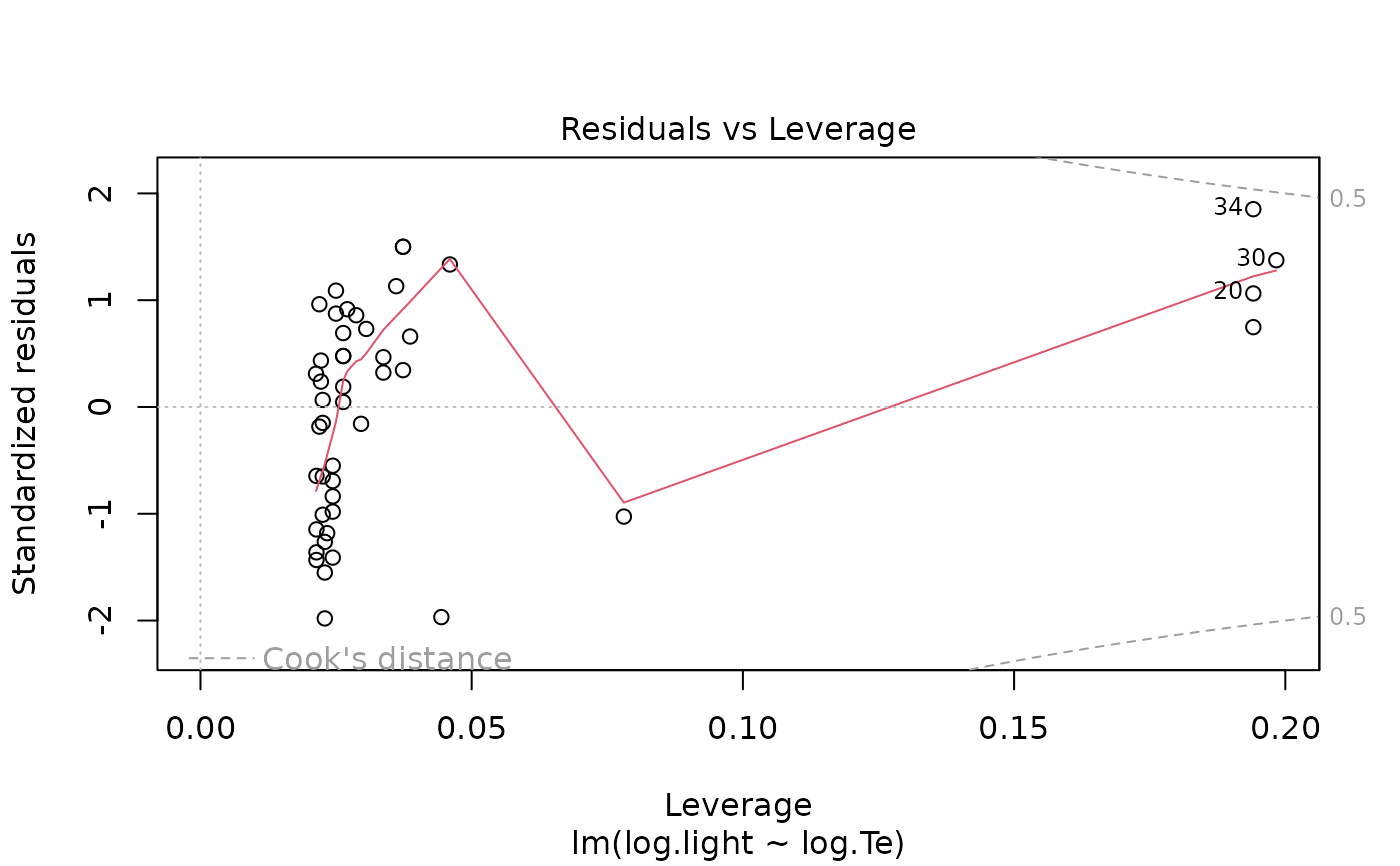
plot(lm.stars)
cst <- covMcd(starsCYG)
lm.stars <- lm(log.light ~ log.Te, data = starsCYG)
summary(lm.stars)
#>
#> Call:
#> lm(formula = log.light ~ log.Te, data = starsCYG)
#>
#> Residuals:
#> Min 1Q Median 3Q Max
#> -1.1052 -0.5067 0.1327 0.4423 0.9390
#>
#> Coefficients:
#> Estimate Std. Error t value Pr(>|t|)
#> (Intercept) 6.7935 1.2365 5.494 1.75e-06 ***
#> log.Te -0.4133 0.2863 -1.444 0.156
#> ---
#> Signif. codes: 0 ‘***’ 0.001 ‘**’ 0.01 ‘*’ 0.05 ‘.’ 0.1 ‘ ’ 1
#>
#> Residual standard error: 0.5646 on 45 degrees of freedom
#> Multiple R-squared: 0.04427, Adjusted R-squared: 0.02304
#> F-statistic: 2.085 on 1 and 45 DF, p-value: 0.1557
#>
plot(lm.stars)
 lts.stars <- ltsReg(log.light ~ log.Te, data = starsCYG)
plot(lts.stars)
lts.stars <- ltsReg(log.light ~ log.Te, data = starsCYG)
plot(lts.stars)