Toxicity of Carboxylic Acids Data
toxicity.RdThe aim of the experiment was to predict the toxicity of carboxylic acids on the basis of several molecular descriptors.
data(toxicity, package="robustbase")Format
A data frame with 38 observations on the following 10 variables which are attributes for carboxylic acids:
toxicityaquatic toxicity, defined as \(\log(IGC_{50}^{-1})\); typically the “response”.
logKow\(log Kow\), the partition coefficient
pKapKa: the dissociation constant
ELUMOEnergy of the lowest unoccupied molecular orbital
EcarbElectrotopological state of the carboxylic group
EmetElectrotopological state of the methyl group
RMMolar refractivity
IRRefraction index
TsSurface tension
PPolarizability
Source
The website accompanying the MMY-book: https://www.wiley.com/legacy/wileychi/robust_statistics/
References
Maguna, F.P., Núñez, M.B., Okulik, N.B. and Castro, E.A. (2003) Improved QSAR analysis of the toxicity of aliphatic carboxylic acids; Russian Journal of General Chemistry 73, 1792–1798.
Examples
data(toxicity)
summary(toxicity)
#> toxicity logKow pKa ELUMO
#> Min. :-0.9400 Min. :-0.5900 Min. :-0.2000 Min. :1.860
#> 1st Qu.:-0.4675 1st Qu.: 0.7375 1st Qu.: 0.2472 1st Qu.:4.393
#> Median :-0.2250 Median : 1.5750 Median : 0.8913 Median :4.700
#> Mean :-0.1558 Mean : 1.6668 Mean : 0.6489 Mean :4.344
#> 3rd Qu.: 0.0800 3rd Qu.: 2.6475 3rd Qu.: 0.9675 3rd Qu.:4.830
#> Max. : 0.9000 Max. : 4.4200 Max. : 1.0200 Max. :4.970
#> Ecarb Emet RM IR
#> Min. :15.40 Min. :-0.8056 Min. :15.33 Min. :1.397
#> 1st Qu.:16.89 1st Qu.: 0.8425 1st Qu.:26.56 1st Qu.:1.425
#> Median :17.23 Median : 2.5304 Median :31.43 Median :1.444
#> Mean :17.19 Mean : 3.1191 Mean :34.27 Mean :1.446
#> 3rd Qu.:17.71 3rd Qu.: 4.5039 3rd Qu.:40.72 3rd Qu.:1.470
#> Max. :18.48 Max. :11.2898 Max. :70.03 Max. :1.478
#> Ts P
#> Min. :30.20 Min. : 1.422
#> 1st Qu.:32.55 1st Qu.: 1.462
#> Median :33.15 Median : 1.476
#> Mean :38.14 Mean : 6.808
#> 3rd Qu.:41.50 3rd Qu.:12.430
#> Max. :70.50 Max. :21.630
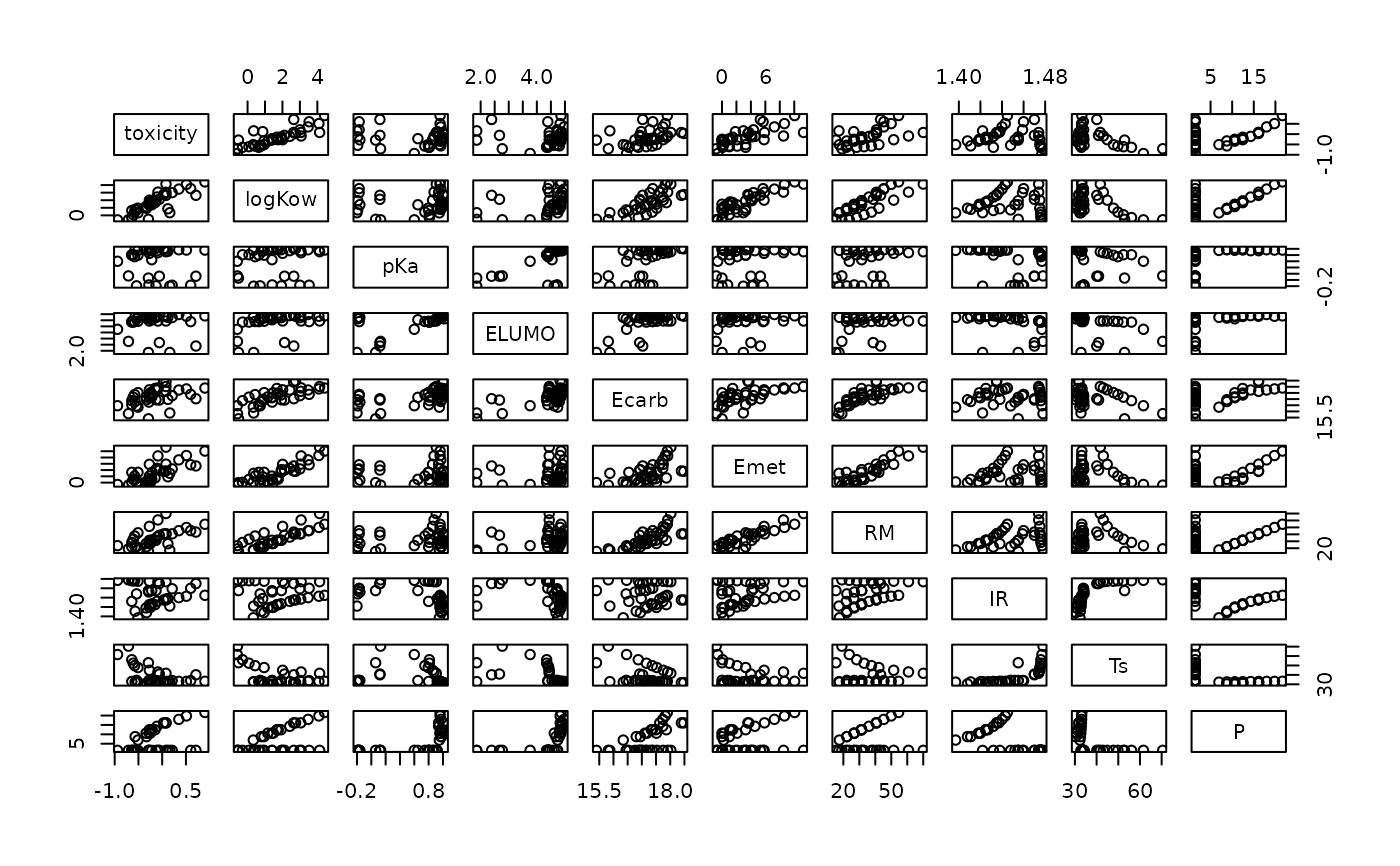
plot(toxicity)
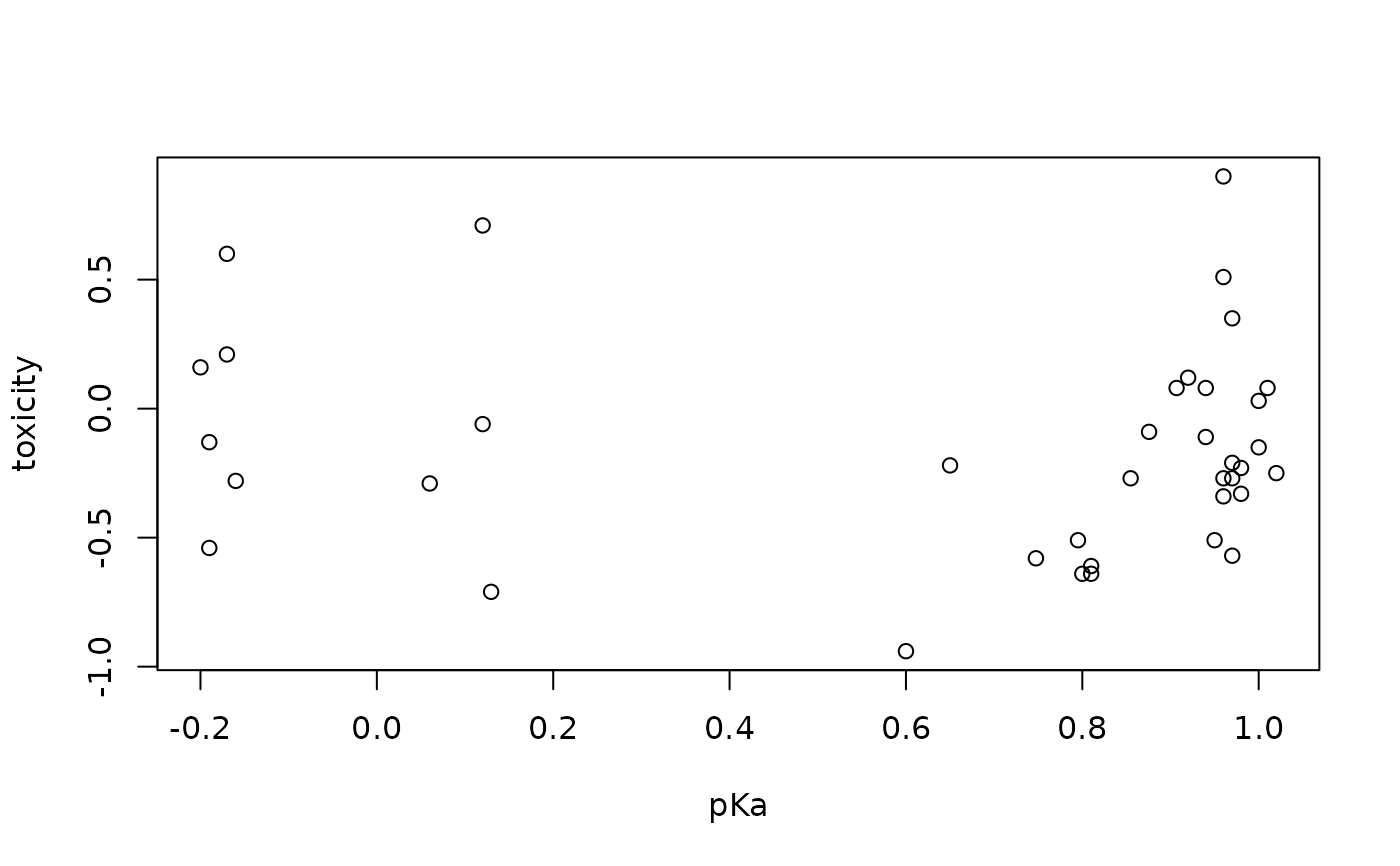
 plot(toxicity ~ pKa, data = toxicity)
 ## robustly scale the data (to scale 1) using Qn
(scQ.tox <- sapply(toxicity, Qn))
#> toxicity logKow pKa ELUMO Ecarb Emet
#> 0.40414939 1.45493782 0.12649876 0.24248964 0.70645314 2.62191920
#> RM IR Ts P
#> 12.40738642 0.02424896 2.62697107 0.06668465
scTox <- scale(toxicity, center = FALSE, scale = scQ.tox)
csT <- covOGK(scTox, n.iter = 2,
sigmamu = s_Qn, weight.fn = hard.rejection)
as.dist(round(cov2cor(csT$cov), 2))
#> 1 2 3 4 5 6 7 8 9
#> 2 0.91
#> 3 -0.32 -0.17
#> 4 -0.25 -0.05 0.64
#> 5 -0.01 0.28 0.48 0.48
#> 6 0.88 0.72 -0.50 -0.54 -0.08
#> 7 0.78 0.78 -0.11 -0.06 0.36 0.77
#> 8 0.32 0.13 -0.57 -0.84 -0.22 0.70 0.41
#> 9 -0.28 -0.35 -0.11 -0.50 0.00 0.11 0.14 0.72
#> 10 0.36 0.18 -0.25 -0.07 -0.06 0.41 0.43 0.24 0.09
## robustly scale the data (to scale 1) using Qn
(scQ.tox <- sapply(toxicity, Qn))
#> toxicity logKow pKa ELUMO Ecarb Emet
#> 0.40414939 1.45493782 0.12649876 0.24248964 0.70645314 2.62191920
#> RM IR Ts P
#> 12.40738642 0.02424896 2.62697107 0.06668465
scTox <- scale(toxicity, center = FALSE, scale = scQ.tox)
csT <- covOGK(scTox, n.iter = 2,
sigmamu = s_Qn, weight.fn = hard.rejection)
as.dist(round(cov2cor(csT$cov), 2))
#> 1 2 3 4 5 6 7 8 9
#> 2 0.91
#> 3 -0.32 -0.17
#> 4 -0.25 -0.05 0.64
#> 5 -0.01 0.28 0.48 0.48
#> 6 0.88 0.72 -0.50 -0.54 -0.08
#> 7 0.78 0.78 -0.11 -0.06 0.36 0.77
#> 8 0.32 0.13 -0.57 -0.84 -0.22 0.70 0.41
#> 9 -0.28 -0.35 -0.11 -0.50 0.00 0.11 0.14 0.72
#> 10 0.36 0.18 -0.25 -0.07 -0.06 0.41 0.43 0.24 0.09