Autocompute P-value Positions For Plotting Significance
Source:R/get_pvalue_position.R
get_pvalue_position.RdCompute p-value x and y positions for plotting significance levels. Many examples are provided at :
Usage
get_y_position(
  data,
  formula,
  fun = "max",
  ref.group = NULL,
  comparisons = NULL,
  step.increase = 0.12,
  y.trans = NULL,
  stack = FALSE,
  scales = c("fixed", "free", "free_y")
)

add_y_position(
  test,
  fun = "max",
  step.increase = 0.12,
  data = NULL,
  formula = NULL,
  ref.group = NULL,
  comparisons = NULL,
  y.trans = NULL,
  stack = FALSE,
  scales = c("fixed", "free", "free_y")
)

add_x_position(
  test,
  x = NULL,
  group = NULL,
  dodge = 0.8,
  scales = c("fixed", "free", "free_y")
)

add_xy_position(
  test,
  x = NULL,
  group = NULL,
  dodge = 0.8,
  stack = FALSE,
  fun = "max",
  step.increase = 0.12,
  scales = c("fixed", "free", "free_y"),
  ...
)
Arguments
- data
a data.frame containing the variables in the formula.
- formula
a formula of the form
x ~ groupwherexis a numeric variable giving the data values andgroupis a factor with one or multiple levels giving the corresponding groups. For example,formula = TP53 ~ cancer_group.- fun
summary statistics functions used to compute automatically suitable y positions of p-value labels and brackets. Possible values include:
"max", "mean", "mean_sd", "mean_se", "mean_ci", "median", "median_iqr", "median_mad".For example, if
fun = "max", the y positions are guessed as follow:1. Compute the maximum of each group (groups.maximum)
2. Use the highest groups maximum as the first bracket y position
3. Add successively a step increase for remaining bracket y positions.
When the main plot is a boxplot, you need the option
fun = "max", to have the p-value bracket displayed at the maximum point of the group.In some situations the main plot is a line plot or a barplot showing the
mean+/-error barsof the groups, where error can be SE (standard error), SD (standard deviation) or CI (confidence interval). In this case, to correctly compute the bracket y position you need the optionfun = "mean_se", etc.- ref.group
a character string specifying the reference group. If specified, for a given grouping variable, each of the group levels will be compared to the reference group (i.e. control group).
- comparisons
A list of length-2 vectors specifying the groups of interest to be compared. For example to compare groups "A" vs "B" and "B" vs "C", the argument is as follow:
comparisons = list(c("A", "B"), c("B", "C"))- step.increase
numeric vector with the increase in fraction of total height for every additional comparison to minimize overlap.
- y.trans
a function for transforming y axis scale. Value can be
log2,log10andsqrt. Can be also any custom function that can take a numeric vector as input and returns a numeric vector, example:y.trans = function(x){log2(x+1)}- stack
logical. If TRUE, computes y position for a stacked plot. Useful when dealing with stacked bar plots.
- scales
Should scales be fixed (
"fixed", the default), free ("free"), or free in one dimension ("free_y")?. For the y position,"free"or"free_y"compute the step increase per plot panel (otherwise a global step increase is used). For the x position, whenscales = "free"the x positions (xmin/xmax) are computed per facet, so that brackets align correctly when a faceted plot (facet_*(scales = "free")) shows a different set of x-axis levels in each panel ("free_y"keeps the global x positions).- test
an object of class
rstatix_testas returned byt_test(),wilcox_test(),sign_test(),tukey_hsd(),dunn_test().- x
variable on x axis.
- group
group variable (legend variable).
- dodge
dodge width for grouped ggplot/test. Default is 0.8. Used only when
xspecified.- ...
other arguments to be passed to the function
t.test.
Functions
get_y_position(): compute the p-value y positionsadd_y_position(): add p-value y positions to an object of classrstatix_testadd_x_position(): compute and add p-value x positions.add_xy_position(): compute and add both x and y positions.
Added columns
add_y_position() adds y.position;
add_x_position() adds x, xmin, xmax; and
add_xy_position() adds all of these. A column named groups (the
pair of compared groups, used internally to position dodged grouped
comparisons) is also added. groups is a reserved internal
column: do not rely on it and avoid using groups as one of your own
column names in the test object, since it is overwritten here. (It may be
renamed to a dotted, less collision-prone name in a future major version.)
Examples
# Data preparation
#::::::::::::::::::::::::::::::::::::
df <- ToothGrowth
df$dose <- as.factor(df$dose)
df$group <- factor(rep(c(1, 2), 30))
head(df)
#> len supp dose group
#> 1 4.2 VC 0.5 1
#> 2 11.5 VC 0.5 2
#> 3 7.3 VC 0.5 1
#> 4 5.8 VC 0.5 2
#> 5 6.4 VC 0.5 1
#> 6 10.0 VC 0.5 2
# Stat tests
#::::::::::::::::::::::::::::::::::::
stat.test <- df %>%
t_test(len ~ dose)
stat.test
#> # A tibble: 3 × 10
#> .y. group1 group2 n1 n2 statistic df p p.adj p.adj.signif
#> * <chr> <chr> <chr> <int> <int> <dbl> <dbl> <dbl> <dbl> <chr>
#> 1 len 0.5 1 20 20 -6.48 38.0 1.27e- 7 2.54e- 7 ****
#> 2 len 0.5 2 20 20 -11.8 36.9 4.40e-14 1.32e-13 ****
#> 3 len 1 2 20 20 -4.90 37.1 1.91e- 5 1.91e- 5 ****
# Add the test into box plots
#::::::::::::::::::::::::::::::::::::
stat.test <- stat.test %>%
add_y_position()
# \donttest{
if(require("ggpubr")){
ggboxplot(df, x = "dose", y = "len") +
stat_pvalue_manual(stat.test, label = "p.adj.signif", tip.length = 0.01)
}
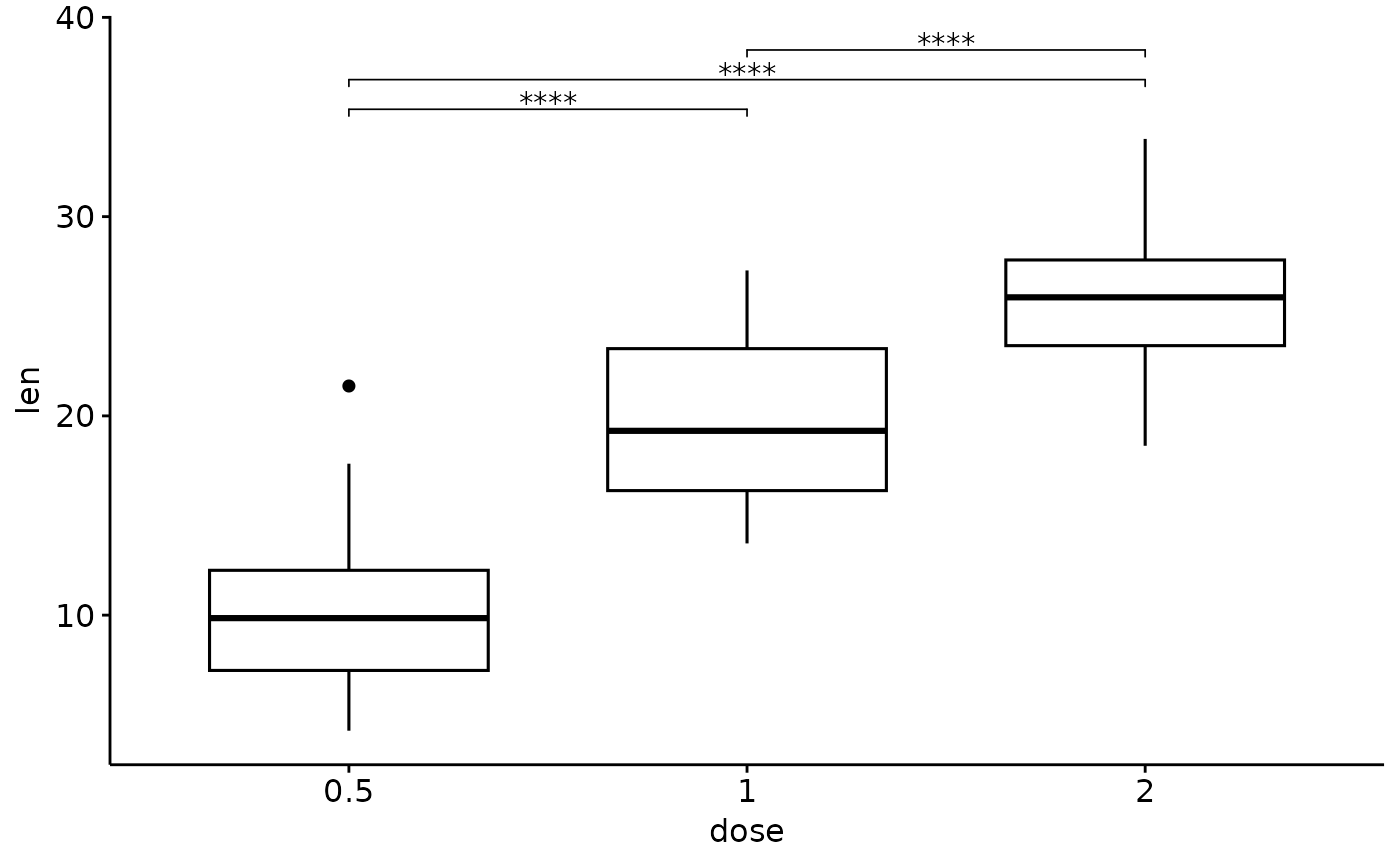 # }
# }